The rarity of draws suggests that a Poisson distribution could be fitted to these data. The average number of draws is 1.229. Using a Poisson distribution with this mean gives predicted frequencies shown in the graph, with the observed frequencies.
Sport
Statistics in sport such as Sydney to Hobart yacht race and AFL draws.
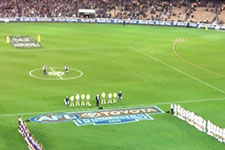
AFL DRAWS
Australian Rules Football (AFL) is a football code in which there are "goals" and "behinds".
A goal scores 6 points and a behind scores 1 point. An example score is "13 10 88",
which means 13 goals, 10 behinds = 88 points. Because a large range of total
scores in a game are possible, draws are quite rare.
The current AFL national competition involving 16 teams had its origins in 1897 in the state of Victoria, in the Victoria Football League (VFL). The records of the VFL and AFL are often considered together, representing the elite Australian rules football competitions over that time period.
There have been 109 seasons between 1897 and 2005 (inclusive).
The distribution of the number of draws per season is as follows:
| Number of draws | Count |
|---|---|
| 0 | 28 |
| 1 | 47 |
| 2 | 21 |
| 3 | 8 |
| 4 | 4 |
| 5 | 1 |
The predicted frequencies are similar to the observed frequencies. The data fit a Poisson model quite well.
The year 1977 was particularly unusual: the Grand Final was a draw, and hence was replayed the following week, and in round 7 of that year there were two draws.
In one of them the points scored by both teams were 98, and in the other, 99.
Grand Final draws between 1897-2005
| Row | Year | Draws | Row | Year | Draws | |
|---|---|---|---|---|---|---|
| 1 | 1897 | 1 | 56 | 1952 | 3 | |
| 2 | 1898 | 1 | 57 | 1953 | 1 | |
| 3 | 1899 | 0 | 58 | 1954 | 2 | |
| 4 | 1900 | 0 | 59 | 1955 | 0 | |
| 5 | 1901 | 1 | 60 | 1956 | 2 | |
| 6 | 1902 | 0 | 61 | 1957 | 2 | |
| 7 | 1903 | 1 | 62 | 1958 | 0 | |
| 8 | 1904 | 1 | 63 | 1959 | 1 | |
| 9 | 1905 | 1 | 64 | 1960 | 2 | |
| 10 | 1906 | 0 | 65 | 1961 | 3 | |
| 11 | 1907 | 0 | 66 | 1962 | 1 | |
| 12 | 1908 | 0 | 67 | 1963 | 1 | |
| 13 | 1909 | 3 | 68 | 1964 | 2 | |
| 14 | 1910 | 1 | 69 | 1965 | 0 | |
| 15 | 1911 | 3 | 70 | 1966 | 1 | |
| 16 | 1912 | 0 | 71 | 1967 | 2 | |
| 17 | 1913 | 1 | 72 | 1968 | 2 | |
| 18 | 1914 | 4 | 73 | 1969 | 1 | |
| 19 | 1915 | 1 | 74 | 1970 | 0 | |
| 20 | 1916 | 1 | 75 | 1971 | 2 | |
| 21 | 1917 | 2 | 76 | 1972 | 2 | |
| 22 | 1918 | 0 | 77 | 1973 | 1 | |
| 23 | 1919 | 1 | 78 | 1974 | 2 | |
| 24 | 1920 | 0 | 79 | 1975 | 0 | |
| 25 | 1921 | 5 | 80 | 1976 | 1 | |
| 26 | 1922 | 2 | 81 | 1977 | 4 | |
| 27 | 1923 | 1 | 82 | 1978 | 1 | |
| 28 | 1924 | 1 | 83 | 1979 | 1 | |
| 29 | 1925 | 1 | 84 | 1980 | 3 | |
| 30 | 1926 | 1 | 85 | 1981 | 0 | |
| 31 | 1927 | 1 | 86 | 1982 | 1 | |
| 32 | 1928 | 1 | 87 | 1983 | 0 | |
| 33 | 1929 | 2 | 88 | 1984 | 0 | |
| 34 | 1930 | 0 | 89 | 1985 | 1 | |
| 35 | 1931 | 0 | 90 | 1986 | 0 | |
| 36 | 1932 | 1 | 91 | 1987 | 2 | |
| 37 | 1933 | 1 | 92 | 1988 | 1 | |
| 38 | 1934 | 1 | 93 | 1989 | 1 | |
| 39 | 1935 | 4 | 94 | 1990 | 1 | |
| 40 | 1936 | 0 | 95 | 1991 | 2 | |
| 41 | 1937 | 1 | 96 | 1992 | 2 | |
| 42 | 1938 | 0 | 97 | 1993 | 1 | |
| 43 | 1939 | 1 | 98 | 1994 | 1 | |
| 44 | 1940 | 0 | 99 | 1995 | 3 | |
| 45 | 1941 | 0 | 100 | 1996 | 3 | |
| 46 | 1942 | 0 | 101 | 1997 | 1 | |
| 47 | 1943 | 1 | 102 | 1998 | 1 | |
| 48 | 1944 | 4 | 103 | 1999 | 1 | |
| 49 | 1945 | 1 | 104 | 2000 | 2 | |
| 50 | 1946 | 1 | 105 | 2001 | 0 | |
| 51 | 1947 | 2 | 106 | 2002 | 2 | |
| 52 | 1948 | 2 | 107 | 2003 | 3 | |
| 53 | 1949 | 0 | 108 | 2004 | 0 | |
| 54 | 1950 | 1 | 109 | 2005 | 1 | |
| 55 | 1951 | 2 |
SYDNEY TO HOBART YACHT RACE WINNING TIMES
The Sydney-Hobart yacht race starts from Sydney Harbour on Boxing Day
(26 December) and finishes several days later in Hobart.
It is a 630 nautical mile ocean race.
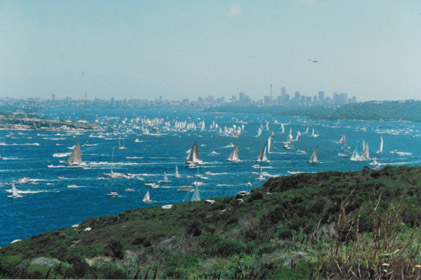
Sydney to Hobart in 1990: A flotilla going through the Sydney Harbour taken from North Head.
The data for 1945-1993 comes from The Sydney Morning Herald (24 December 1994). The more recent data are from the official race website, the Sydney Morning Herald and Wikipedia. The data originally published included an error in the 1965 results; it has been amended here.
The winning time (first across the line) varies quite a bit due to weather and improvements in boat design and sailing techniques. What has been the pattern of improvement over time?
Winning times have generally decreased, from around 6 days to around 2.6 days on average.
How can we describe the pattern further? Using statistical methods to put a straight line on the graph (regression) gives this:
One way to describe the decrease is with a straight line. The straight line above was fitted by linear regression, giving time in days = 98.6 - 0.0480 x year. This describes the decrease quite well. However, we should be cautious about applying this model to future races. For instance, extrapolating suggests that by the year 2033 it will take, on average, around 1 day to win, and by the year 2055 the winning boat will arrive before it leaves!
Are there other ways to describe the changes? Another alternative method fits lines to only parts of the data and joins the results, like this:
This type of method allows for some curving by fitting straight lines to subsets of consecutive years. It makes some other adjustments and is known as 'locally weighted regression', or 'lowess' for short. The lowess curve is shown above. It shows that after about 1975 the rate of improvement slowed down. The lowess curve helps visualize the changes over time, but it does not give us a formal mathematical model of the change over time.
HERE ARE THE WINNING TIMES FOR 1945 TO 2011
| Year | Line Honours Winner | days | hours | Minutes | Time |
|---|---|---|---|---|---|
| 1945 | Rani | 6 | 14 | 22 | 6.60 |
| 1946 | Morna | 5 | 2 | 53 | 5.12 |
| 1947 | Morna | 5 | 3 | 3 | 5.13 |
| 1948 | Morna | 4 | 5 | 1 | 4.21 |
| 1949 | Waltzing Matilda | 5 | 10 | 33 | 5.44 |
| 1950 | Margaret Rintoul | 5 | 5 | 28 | 5.23 |
| 1951 | Margaret Rintoul | 4 | 2 | 29 | 4.10 |
| 1952 | Nocturne | 6 | 2 | 34 | 6.11 |
| 1953 | Solveig | 5 | 7 | 12 | 5.30 |
| 1954 | Kurrewa IV | 5 | 6 | 9 | 5.26 |
| 1955 | Even | 4 | 18 | 13 | 4.76 |
| 1956 | Kurrewa IV | 4 | 4 | 31 | 4.19 |
| 1957 | Kurrewa IV | 3 | 18 | 30 | 3.77 |
| 1958 | Solo | 5 | 2 | 32 | 5.11 |
| 1959 | Solo | 4 | 13 | 33 | 4.56 |
| 1960 | Kurrewa IV | 4 | 8 | 11 | 4.34 |
| 1961 | Astor | 4 | 4 | 42 | 4.20 |
| 1962 | Ondine | 3 | 3 | 46 | 3.16 |
| 1963 | Astor | 4 | 10 | 53 | 4.45 |
| 1964 | Astor | 3 | 20 | 5 | 3.84 |
| 1965 | Stormvogel | 3 | 20 | 30 | 3.85 |
| 1966 | Fidelis | 4 | 8 | 39 | 4.36 |
| 1967 | Pen Duick III | 4 | 4 | 10 | 4.17 |
| 1968 | Ondine II | 4 | 30 | 20 | 5.26 |
| 1969 | Crusade | 3 | 15 | 7 | 3.63 |
| 1970 | Buccaneer | 3 | 14 | 6 | 3.59 |
| 1971 | Kialoa | 3 | 12 | 46 | 3.53 |
| 1972 | American Eagle | 3 | 4 | 42 | 3.20 |
| 1973 | Helsal | 3 | 1 | 32 | 3.06 |
| 1974 | Ondine III | 3 | 13 | 51 | 3.58 |
| 1975 | Kialoa | 2 | 14 | 36 | 2.61 |
| 1976 | Ballyhoo | 3 | 7 | 59 | 3.33 |
| 1977 | Kialoa II | 3 | 10 | 14 | 3.43 |
| 1978 | Apollo | 4 | 2 | 23 | 4.10 |
| 1979 | Bumblebee IV | 3 | 1 | 45 | 3.07 |
| 1980 | New Zealand | 2 | 18 | 45 | 2.78 |
| 1981 | Vengeance | 3 | 22 | 30 | 3.94 |
| 1982 | Condor of Bermuda | 3 | 0 | 59 | 3.04 |
| 1983 | Condor | 3 | 0 | 50 | 3.03 |
| 1984 | New Zealand | 3 | 11 | 21 | 3.47 |
| 1985 | Apollo | 3 | 4 | 32 | 3.19 |
| 1986 | Condor of Bermuda | 2 | 23 | 26 | 2.98 |
| 1987 | Sovereign | 2 | 21 | 58 | 2.92 |
| 1988 | Ragamuffin | 3 | 15 | 29 | 3.65 |
| 1989 | Drumbeat | 3 | 6 | 21 | 3.26 |
| 1990 | Ragamuffin | 2 | 21 | 5 | 2.88 |
| 1991 | Brindabella | 3 | 1 | 14 | 3.05 |
| 1992 | New Zealand Endeavour | 2 | 1 | 19 | 2.80 |
| 1993 | Ninety Seven | 4 | 0 | 54 | 4.04 |
| 1994 | Tasmania | 2 | 17 | 48 | 2.74 |
| 1995 | Sayonara | 3 | 0 | 53 | 3.04 |
| 1996 | Morning Glory | 2 | 14 | 7 | 2.59 |
| 1997 | Brindabella | 2 | 23 | 37 | 2.98 |
| 1998 | Sayonara | 2 | 20 | 3.5 | 2.84 |
| 1999 | Nokia | 1 | 19 | 48 | 1.83 |
| 2000 | Nicorette | 2 | 14 | 2 | 2.58 |
| 2001 | Assa Abloy | 2 | 20 | 46 | 2.87 |
| 2002 | Alfa Romeo | 2 | 4 | 58 | 2.21 |
| 2003 | Skandia | 2 | 15 | 14 | 2.63 |
| 2004 | Nicorette | 2 | 16 | 1 | 2.67 |
| 2005 | Wild Oats XI | 1 | 18 | 40 | 1.78 |
| 2006 | Wild Oats XI | 2 | 8 | 53 | 2.37 |
| 2007 | Wild Oats XI | 1 | 21 | 25 | 1.89 |
| 2008 | Wild Oats XI | 1 | 20 | 34 | 1.86 |
| 2009 | Alfa Romeo II | 2 | 9 | 2 | 2.38 |
| 2010 | Wild Oats XI | 2 | 7 | 37 | 2.32 |
| 2011 | Investec Loyal | 2 | 6 | 14 | 2.26 |