Data Preparation
Preparing your data for analysis
If you are bringing your data along to a consultant, there are several things you might consider doing before you meet. Careful attention to the issues listed below will mean that you can get down to the business of data exploration and analysis much more quickly!
Consultants in the SCC work with a variety of software packages, but if you don't have access to a statistical package you can enter your data on an Excel spreadsheet. Even if you have access to a statistical package, it can be useful to enter the data in Excel first.
You may have your data set up in Excel in a way you find easy to use and understand. This doesn't always suit the requirements of a statistical analysis, so you may need to set up a separate Excel file to give to the consultant.
Here a few tips about entering your data in Excel for a consultant:
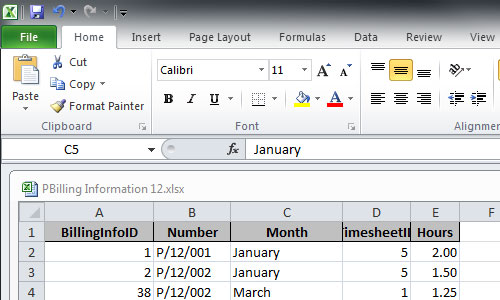
- If possible, enter all the information on a single worksheet.
- Each row should correspond to a single unit on which you have made observations. Of course, that sounds technical – the unit of observation might be a person, a plant, a tooth or a laboratory animal.
- Each column should contain the results for one of the variables you have measured. The top cell in each column should contain the name of the variable.
- Keep the variable name in a single cell, and preferably keep it short. If the variable name is long and you don't want to make the column wider, you can make the label easier to read in the following way. Click on the cell, then use Format > Cell > Alignment and tick the Wrap text box. Finally increase the row height so you can see the whole label.
- Blank rows and columns in the worksheet (say between the heading and the data) are not necessary.
- Be consistent when you are entering information. If you choose to record information about sex, for example, by entering either an "M" or an "F", you need to be consistent for every case. You should not, for example, use lower case or have any blank spaces around the letters. If you know how to use "Pivot Tables" in Excel, this can be a useful way to identify inconsistent entries.
- If information is missing, simply leave the Excel cell blank.
- If you have information that can identify your participants, such as patient names, remove them from the worksheet before you see a consultant.
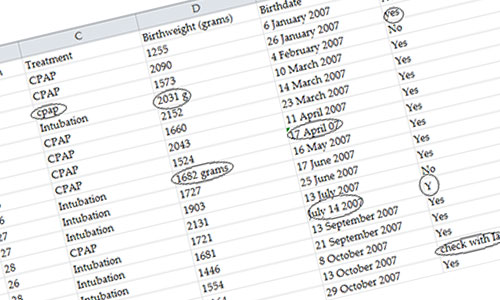
- Check your data entry carefully. Errors arising from data entry might be discovered during the analysis but can waste time. If you are unlucky, they won't be discovered. The best way to ensure there are no mistakes in your data is by entering the data twice, and making sure they are identical. (Of course you don't analyse the double-entered data). Alternatively you can print the data out and check it against the original source.
- Make sure you have dealt with any references in the data that were placed there for checking purposes. "21.4?? ask Brian" is not a good value for a statistical software package to encounter, when it was expecting a numerical value.
- Find out how to use the "Freeze panes" option under the Windows menu in Excel. This allows you to keep the first row and the first column (or some other set of rows and columns) of the spreadsheet visible while you scroll down or to the right. This can be helpful if you have a lot of data to enter.
- If you have already done some analysis or produced some graphs in Excel, remove them from the spreadsheet you give to a consultant. The data file you give to a consultant should include the data and variable names only. (Of course, bring the other information along as well!)
- Excel spreadsheets can be read into a variety of different statistical packages. A consultant can help you with this.
- You can bring an Excel spreadsheet along on a CD or memory stick or you can email it to a consultant.
Before a consultant can start on serious analysis of your data, it is vital to be confident that the data are "clean". There is often some confusion about what this means.
Errors can arise from:
- data entry mistakes
- deviations from a study protocol
Data entry errors might arise from a simple slip in typing that can be picked up by careful checking once the data are entered. Gross errors can be easy to detect. However other errors may not be so apparent. You might (and people have) record the results from one person (or case) for the next person in the data file; this is easy to do if you are transcribing results from one source to another. You might record the results for one variable in the column meant for another variable, or even the same variable in two different columns. These errors can be (and have been) identified once data analysis is underway; however it is better if they are avoided by checking your data entry as you proceed.
Sometimes errors arise from known deviations from a study protocol. A biological sample might have become contaminated, for example. Such cases are generally not included in the data set.
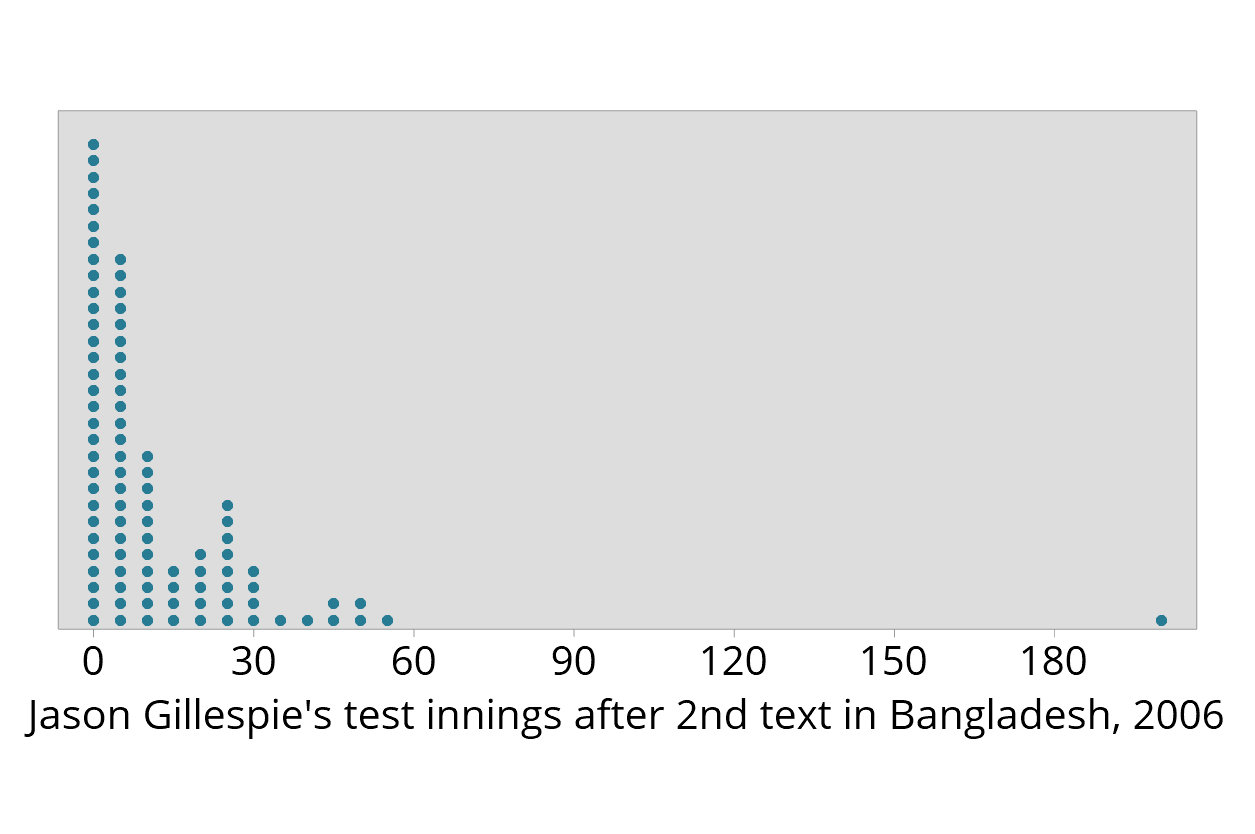
You may have done some exploration and analysis of your data before your meeting with a consultant. You might, for example, have examined the distribution of the outcomes you have measured using a visual display such as an individual value plot, dotplot, scatterplot or boxplot.
This kind of data exploration can assist in identifying errors and values that are relatively unusual. Sometimes the relatively unusual values are referred to as "outliers". However because a value is "unusual" or labelled an "outlier", this does not mean that the value is incorrect or that it should be removed from the data set. It may mean that it is worth checking that indeed no errors have occurred, or that there is not some explanation for why the value is unusual.
Some textbooks recommend removing outliers or even "adjusting" outliers. We strongly recommend that you do not remove or adjust data. The data you bring to a consultant should contain all the correct original data you observed. In a telling example of why not to do this, Antarctic satellite collection data systems automatically deleted outliers, and as a result the hole in the ozone layer was detected much later than it could have been.
There are many reasons why removing valid but somewhat unusual values is not appropriate. A consultant can help you determine if there are unusual values in the data set that cause problems in the analysis and interpretation of your data.
Removing data which are simply at the extremes or adjusting values at the extremes is an extremely dubious scientific practice. Some people regard it as scientific fraud.
In practice, identification of outliers should be done at the stage of modelling data by examining the residuals from a fitted model. An apparent outlier on one particular variable might not be an outlier in the context of fitting a model if, for example, a relatively extreme value on a response variable corresponds to a relatively extreme value on an explanatory variable.