Outliers
You may have done some exploration and analysis of your data before your meeting with a consultant. You might, for example, have examined the distribution of the outcomes you have measured using a visual display such as an individual value plot, dotplot, scatterplot or boxplot.
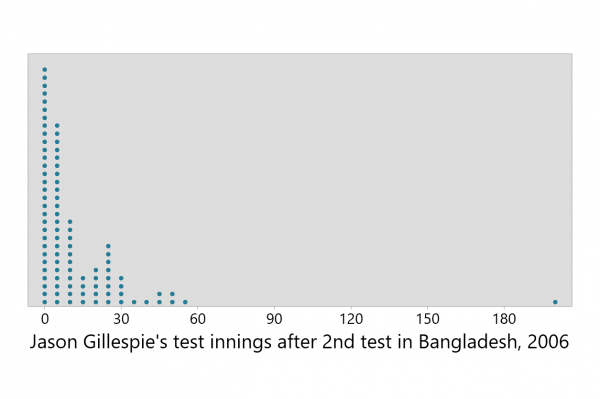
This kind of data exploration can assist in identifying errors and values that are relatively unusual. Sometimes the relatively unusual values are referred to as "outliers". However because a value is "unusual" or labelled an "outlier", this does not mean that the value is incorrect or that it should be removed from the data set. It may mean that it is worth checking that indeed no errors have occurred, or that there is not some explanation for why the value is unusual.
Some textbooks recommend removing outliers or even "adjusting" outliers. We strongly recommend that you do not remove or adjust data. The data you bring to a consultant should contain all the correct original data you observed. In a telling example of why not to do this, Antarctic satellite collection data systems automatically deleted outliers, and as a result the hole in the ozone layer was detected much later than it could have been.
There are many reasons why removing valid but somewhat unusual values is not appropriate. A consultant can help you determine if there are unusual values in the data set that cause problems in the analysis and interpretation of your data.
Removing data which are simply at the extremes or adjusting values at the extremes is an extremely dubious scientific practice. Some people regard it as scientific fraud.
In practice, identification of outliers should be done at the stage of modelling data by examining the residuals from a fitted model. An apparent outlier on one particular variable might not be an outlier in the context of fitting a model if, for example, a relatively extreme value on a response variable corresponds to a relatively extreme value on an explanatory variable.