Understanding two way interactions
AN EXAMPLE
A concern during the Second World War was the provision of vitamin C to soldiers, and in this broad context the effects of ascorbic acid and orange juice were studied in animals. One such study was:
- Crampton E.W. (1947). The growth of the odontoblast of the incisor teeth as a criterion of vitamin C intake of the guinea pig. The Journal of Nutrition, 33(5), 491–504.
Sixty guinea pigs (28 days old) were given a dietary supplement of vitamin C in one of three doses (0.5, 1 or 2 mg/day) delivered in one of two ways (as ascorbic acid or in orange juice). There were ten guinea pigs, five males and five females, in each combination of dose and delivery. After 42 days on the diet, the guinea pigs were sacrificed; incisors were removed and sectioned to obtain measurements on the length of the odontoblasts — cells that are important to tooth development. There could be multiple measurements (odontoblasts) per animal, so the lengths were averaged to give a single value for each animal. The outcome of interest is the average length of the incisor odontoblasts; this was measured in microns. The interest is in how dose and method of delivery influence the outcome.
You may be wondering what a study of cells in guinea pigs has to do with provision of vitamin C to humans. Researchers had established that growth of the odontoblasts in guinea pigs was sensitive to vitamin C intake, and hence measuring odontoblasts could provide a way of reliably measuring uptake of vitamin C. There was a debate about whether ‘biological’ (e.g. orange juice) sources of vitamin C were better than ‘chemical’ forms (e.g. ascorbic acid), and this was explored in an animal model.
You may have seen online posts using data related to this experiment; you can read this post explaining the background to Crampton’s data and some common misunderstandings of the outcome measured.
EXAMINING THE DATA
Here are boxplots of the data:
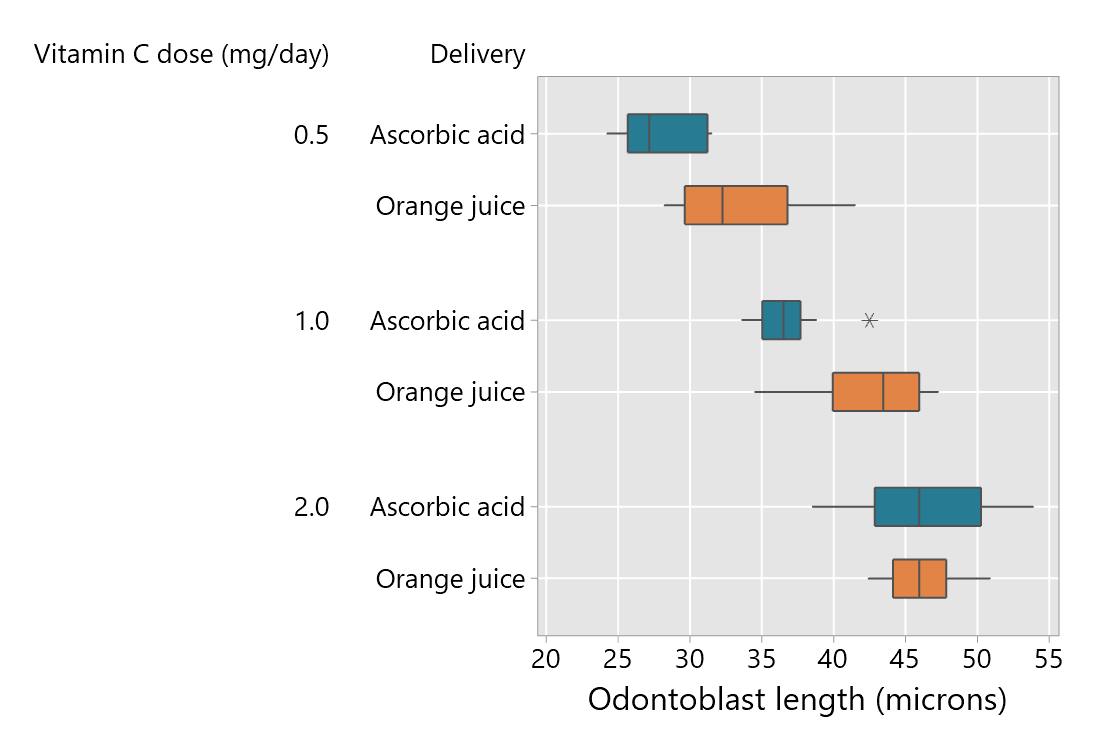
This plot suggests that orange juice is a more effective method of delivery (as longer odontoblasts are ‘better’) when the dose is 0.5 or 1.0 mg/day, but that the method of delivery matters less when the dose is 2.0 mg/day.
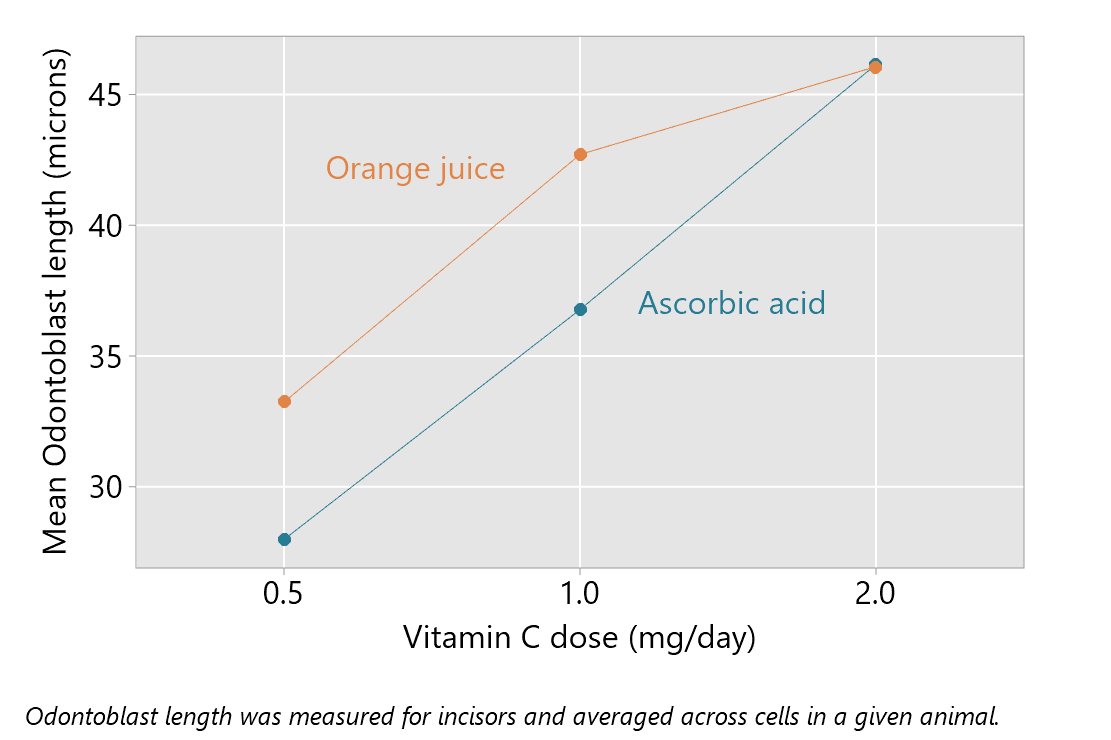
We can also see this in the plot of means, shown below; when the dose is 2.0 mg/day the means for each different mode of delivery are very close. For lower doses, orange juice does better on average.
UNDERSTANDING TWO-WAY INTERACTION
Crampton’s experiment, as described above, involved measurement of a numerical outcome with manipulation of two factors – dose and method of delivery. (Sex of the guinea pig is a third factor but it will not be considered here.) The standard approach to analysis of such an experiment is a ‘two-way analysis of variance’ or, equivalently, a linear model with two factors. In this analysis, the interaction between two explanatory variables is examined.
The idea of interaction can be tricky. The interaction between two factors (explanatory variables) is sometimes called ‘effect modification’. This means that the effect of one of the factors is different at the levels of the other factor. The plot of means below, with some hypothetical examples, can help with thinking about this.
In the top row are three panels where there is no evidence of interaction between dose and method of delivery. Note that the lines for ascorbic acid and orange juice are parallel in each of these panels; this is a feature when there is no interaction. In panel A, for example, the mean for orange juice is 5 microns higher than for ascorbic acid, for each level of dose. (Equivalently, the differences between the means for the levels of dose are the same for each method of delivery.) There is no interaction between the two factors as the effect of one of the factors (method of delivery) is the same at each level of the other factor (dose). In other words, the difference between orange juice and ascorbic acid is the same for each level of dose. And in this example, the differences between 0.5, 1.0 and 2.0 mg/day is the same for each method of delivery.
Panels B and C illustrate other examples with no interaction; in panel B you can also note that there is no effect of dose.
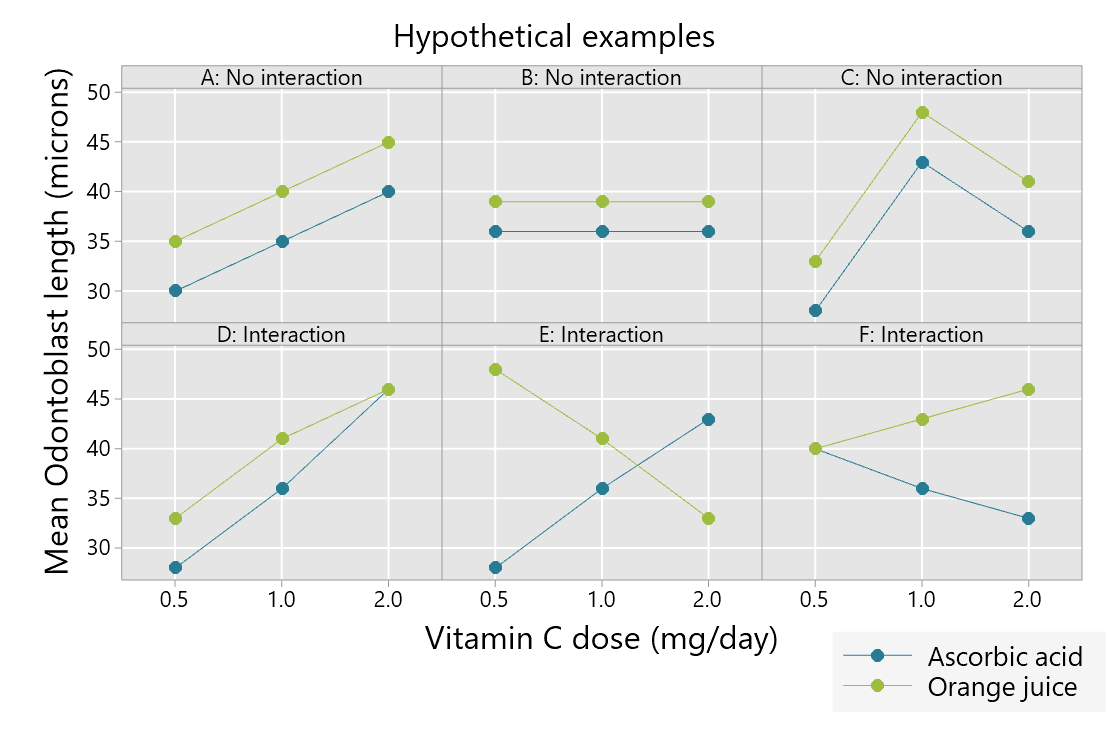
A statistical model involving two factors without an interaction is sometimes referred to as an additive model. In panel A, for example, we would predict the mean odontoblast length for orange juice for any level of dose by adding 5 to the prediction for ascorbic acid. We add the constant, overall effect of orange juice, relative to ascorbic acid.
In the bottom row of the plot with hypothetical examples are three panels where there is evidence of interaction. The lines are not parallel. The difference between methods of delivery depends on the dose. In panel D, which is quite similar to the observed data, there is no mean difference between methods of delivery for doses of 2 mg/day. However for doses of 0.5 and 1.0mg/day, the mean length is higher for orange juice than ascorbic acid.
A statistical model involving two factors with an interaction is sometimes referred to as a non-additive model. As the examples in the bottom row suggest, there can be different patterns of interaction — there are potentially many different ways in which lines on a plot of means might be non-parallel.
In practice, the analysis aims to examine the data for substantial departures from ‘parallelism’ to provide evidence of an interaction. In reporting on a non-additive model, the focus is on the interpretation of the interaction. This is described in a separate blog, where the use of different software is illustrated, continuing with Crampton’s data. You can find the advice on reporting two-way interactions here.