Linear regression
An example
The data for this example comes from measurements made by the US Federal Trade Commission on 25 different varieties of cigarettes: tar, nicotine, and carbon monoxide content. These are substances that are considered hazardous. Here we are interested in predicting the carbon monoxide (mg) emitted from the tar (mg) and nicotine (g) content. The weight of the cigarette (g) was also measured and can be considered in the analysis.
In this example, we first consider simple linear regression where the outcome of interest, carbon monoxide content (mg) is predicted from one continuous explanatory variable. We provide three separate simple regression models, using each of tar content (mg), nicotine content (mg) and weight (g) as the explanatory variable.
We also consider multiple linear regression where carbon monoxide content (mg) is predicted from three continuous explanatory variables simultaneously: tar content (mg), nicotine content (mg) and weight (g).
As the carbon monoxide content is a quantitative variable, the methods of statistical inference that can be applied here usually found under labels such as “linear regression” or “linear model” in software menus or code.
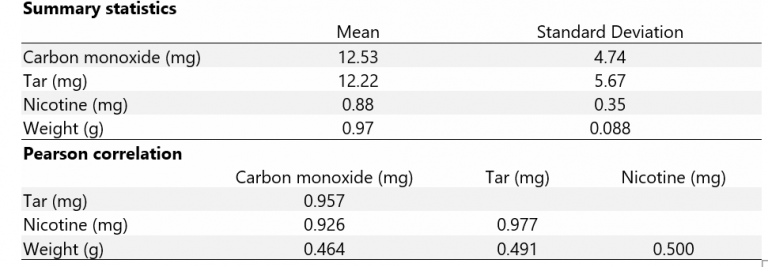
An appropriate report of the analysis may include summary statistics and a graph showing the relationship between the outcome and the explanatory variables. The summary statistics for this type of analysis often include the means and standard deviations for each variable as well as their correlations. Some examples are provided below.

The report of the regression analysis should include the estimated effect of each explanatory variable – the regression slope or regression coefficient – with a 95% confidence interval, and a P-value. The P-value is for a test of the null hypothesis that the true regression coefficient is zero. In the context of multiple linear regression, an overall test of the null hypothesis that all true regression coefficients are zero may also be reported. In some disciplines, the test statistic and degrees of freedom are reported with the P-value for the overall test.
Two tables are provided below, summarising the test statistics and providing the regression coefficients respectively.

The regression coefficients indicate the predicted change in carbon monoxide content (mg) for a one point increase in the relevant explanatory variable. To interpret this appropriately, we need to consider the scale range of the explanatory variable; for nicotine content, for example, the scale range is about two, and an increase of one mg in nicotine content is a relatively large change on this scale. In contrast the scale range for tar content is about 30 mg. It is sometimes useful to use a linear rescaling of the explanatory variables based on a meaningful scale change. Tar content, for example, could be rescaled to 5mg units.
The multiple regression model illustrates how the adjustment for other explanatory variables can have a strong influence on the effect of a particular explanatory variable; consider the simple model using nicotine content and the effect of nicotine content in the multiple variable model. Why does this arise? Examine the table of summary statistics above, and strength of relationship between the three explanatory variables considered.
In the examples of the output for reporting the regression analysis provided below, the simple linear regression using tar content (mg) is provided along with the multiple regression results. The results for the other two simple linear regression models are not provided (for simplicity).
Minitab 19
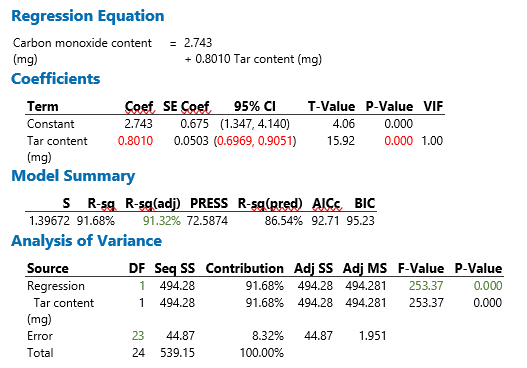
The output from Minitab 19 relevant to reporting the regression is shown here. Results for the test statistics table are in green; results for the coefficients table are in red.
Predicting Carbon monoxide content from Tar content:
Predicting Carbon monoxide content from Tar content, Nicotine content and Weight:

R
The output in R is shown below; RMarkdown has been used to produce this output. Often the results provided by R need to be rounded. The relevant output is underlined in green and red.
Predicting Carbon monoxide content from Tar content: 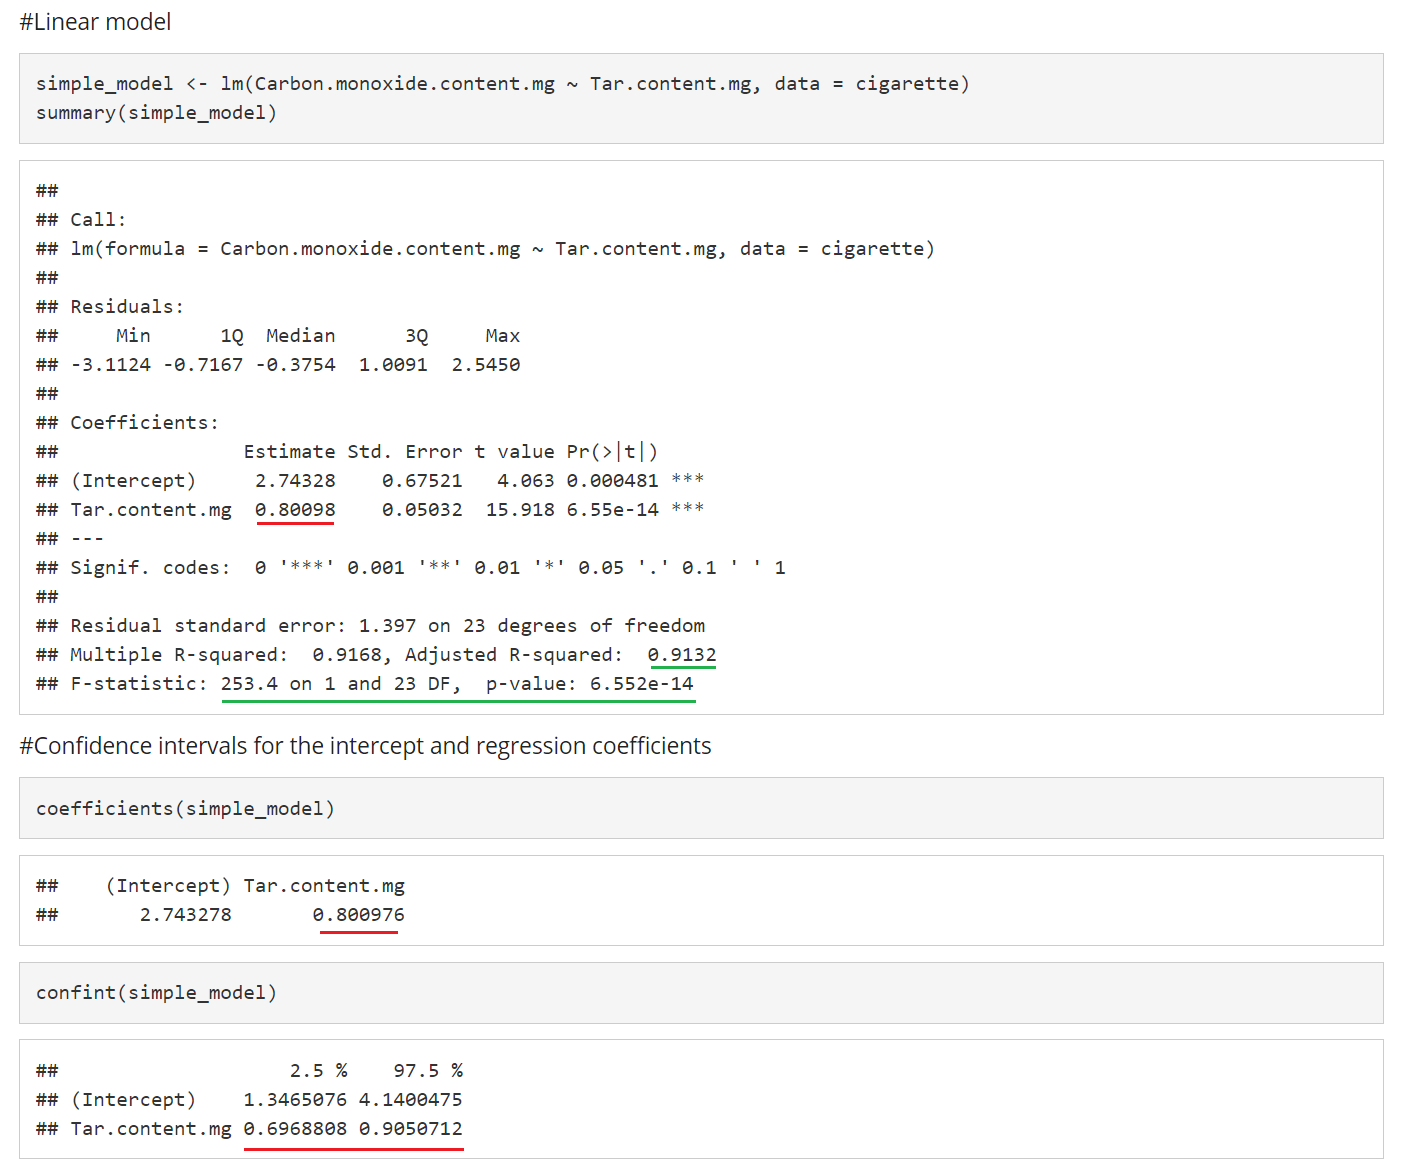
Predicting Carbon monoxide content from Tar content, Nicotine content and Weight: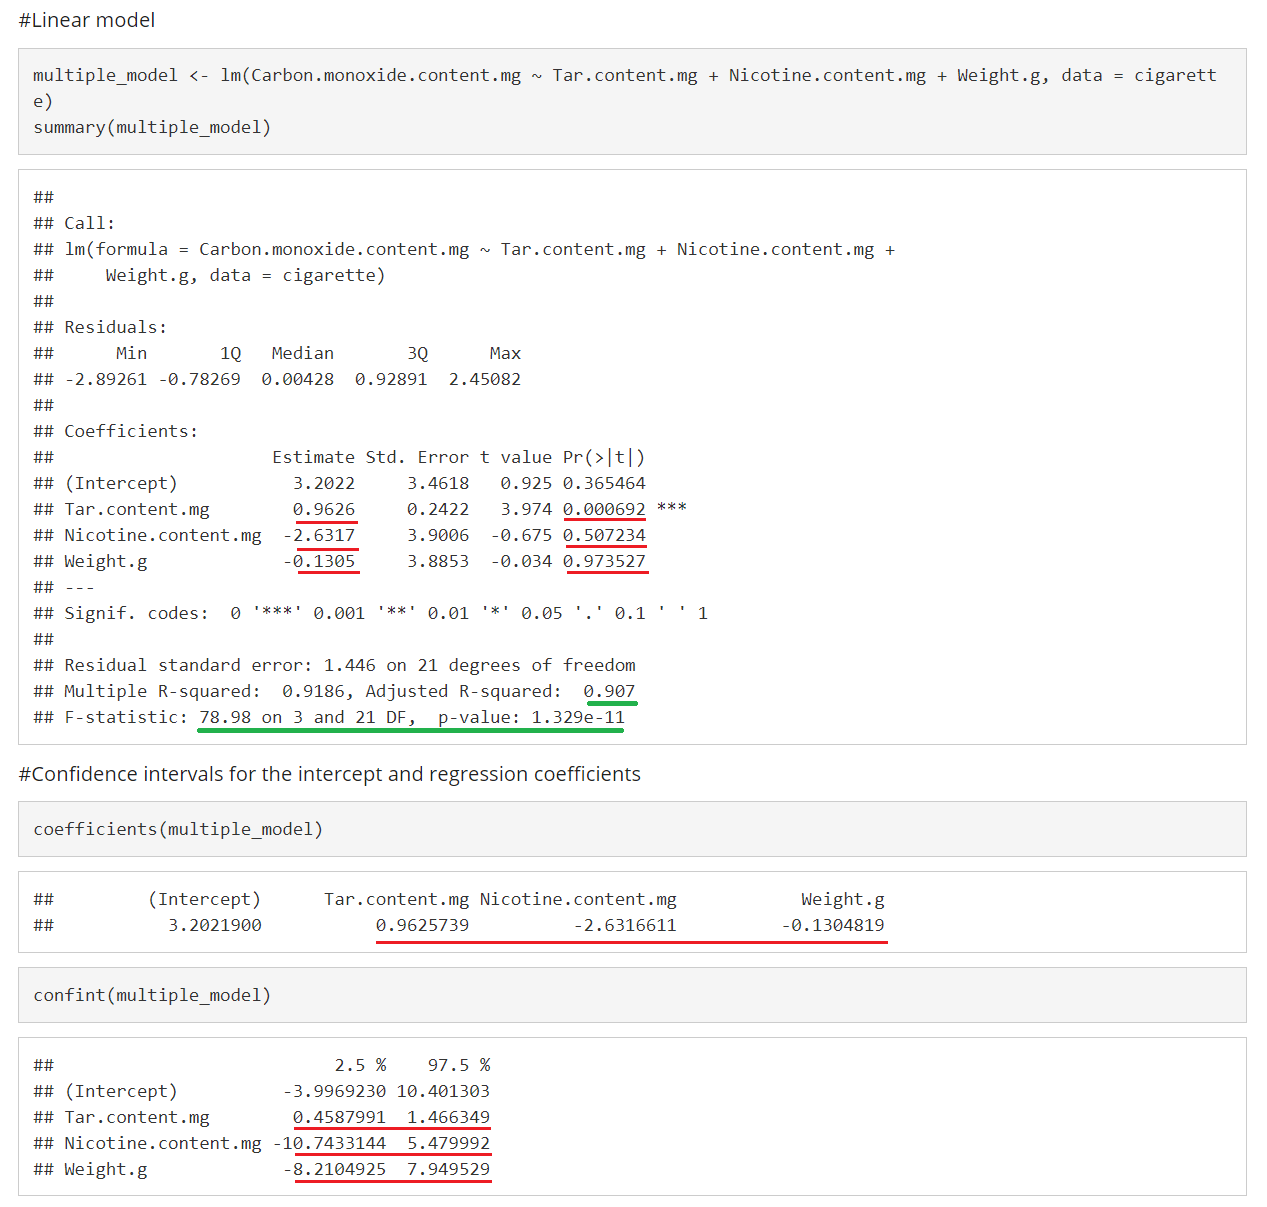
Reference for the data
Mendenhall and Sincich (1992), Statistics for Engineering and the Sciences (3rd ed.), New York: Dellen Publishing Co.