Worried about Normality?
Clients will often come to a statistician with a concern that "things are not normal!" Most often this is a worry that the data they have does not appear to be consistent with bell-shaped curve – a Normal distribution.
This is where the statistician needs to tread carefully.
- First, the good news: most of the time "Normality" does not matter!
- Then, the bad news: there are other things to worry about ...
A concern about "Normality" often arises when using a statistical analysis for a numerical outcome such as an independent samples t-test, analysis of variance, regression or linear model. People often focus on three assumptions in these contexts:
- Independence
- Constant variance
- Normality
These assumptions do all need careful consideration, but there's more.
More generally there are other assumptions, which this resources post does not address, including random selection or treatment assignment, measurement, missing data and selective reporting.
You can read more about these assumptions in our upcoming post on Checking model assumptions.
What do these assumptions refer to?
Behind any of these analyses is a statistical model; it describes how we predict the outcome (or dependent variable) from the explanatory variable or variables of interest.
We don't expect data to fit the statistical model perfectly, but we assume that random deviations in data from the model have certain characteristics. The assumptions (listed above) are about the deviations from the model. They do not refer to the properties of the outcome (or any explanatory) variable.
You might have learnt about this idea in regression. Linear regression is a useful example to think about.
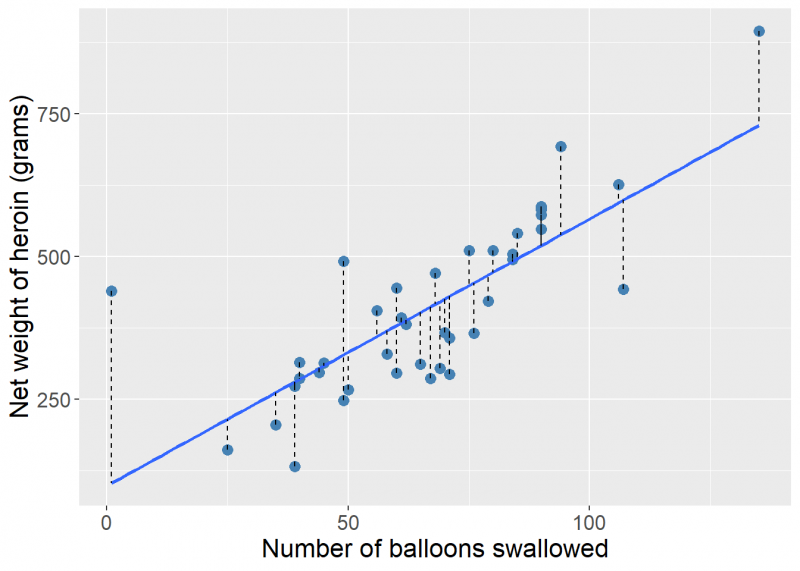
Drug smugglers sometimes swallow balloons filled with illicit drugs as a way of importing the drugs when flying from country to country. A court case involved estimating the net weight of heroin imported from the number of balloons swallowed by a particular smuggler. In this case the number of balloons was known, but not the weight. There were data available from other arrests on the net weight and number of balloons, as shown in the graph on the right. (This example comes from Gastwirth (2000), Statistical Science in the Courtroom, Springer-Verlag.)
Why do the assumptions matter?
If the assumptions are wrong, then the results of your analysis can be wrong. Yes, the P-values can be wrong! As can other inferences: confidence intervals and prediction intervals.
However, some assumptions matter more than others.
Normality
Ironically, the assumption that matters least is often the one people worry about most. Provided you have a sufficiently large number of observations, the analysis will be robust even if the residuals do not appear to be consistent with a Normal distribution.
Of course, whenever a statistician says "if the sample size is large enough", the immediate question is "so how many is large?" And the (perhaps frustrating) response is "it depends". Conservatively, a sample size of 120 is large enough, and in many situations fewer may suffice. You can read more about this in Checking model assumptions.
Examining the distribution of the data overall isn't informative
-
Importantly, except for situations where we are considering a single random sample from a hypothesised underlying distribution, considering the distribution “of the data” – that is, the dataset as a whole – is not useful. This is because we usually have in mind explanatory variables and a systematic component to a model for the data, and moderate to strong effects in the systematic part can easily cause the overall distribution of the data to be bimodal (for example) and non-Normal.
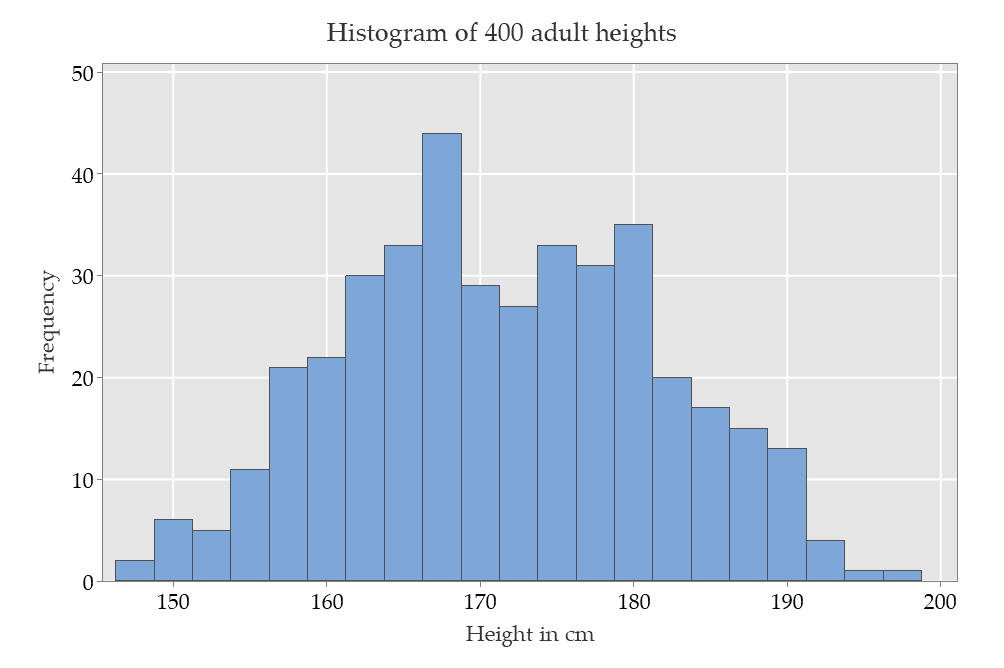
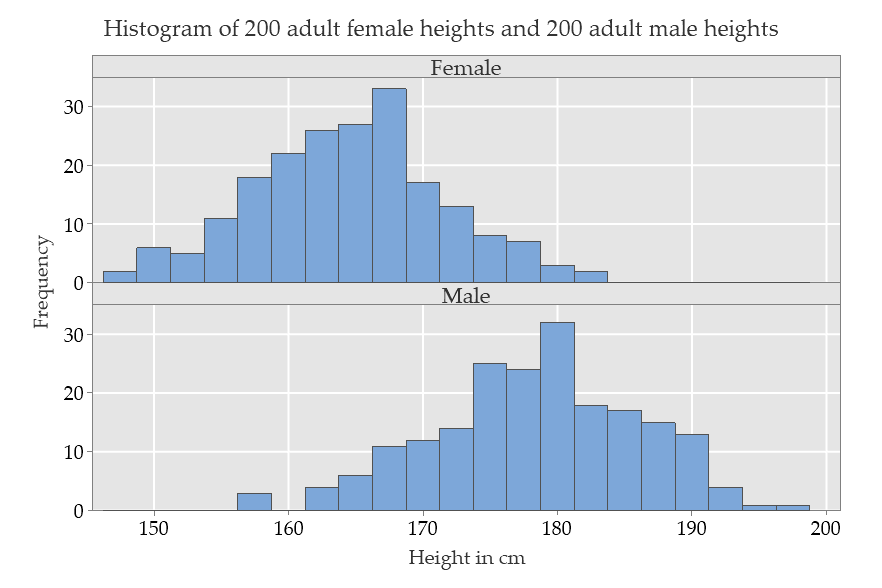
If you had a large sample of adult heights, you would (rightly) conclude that “my data are not Normally distributed!”. But if you look separately at the heights by sex at birth, you would find two histograms that closely conform to two different Normal distributions.
Here's an example.
When the heights of 200 adult females and 200 adult males are plotted in a single histogram, the distribution is flatter (less peaked) than a Normal distribution.
When the data are separated by group, each histogram is much more consistent with data from a Normal distribution.
-
Here' s a made-up example. Imagine you plan to fit a straight line model predicting an outcome (y) from a continuous explanatory variable (x).
You examine the distribution of the outcome:
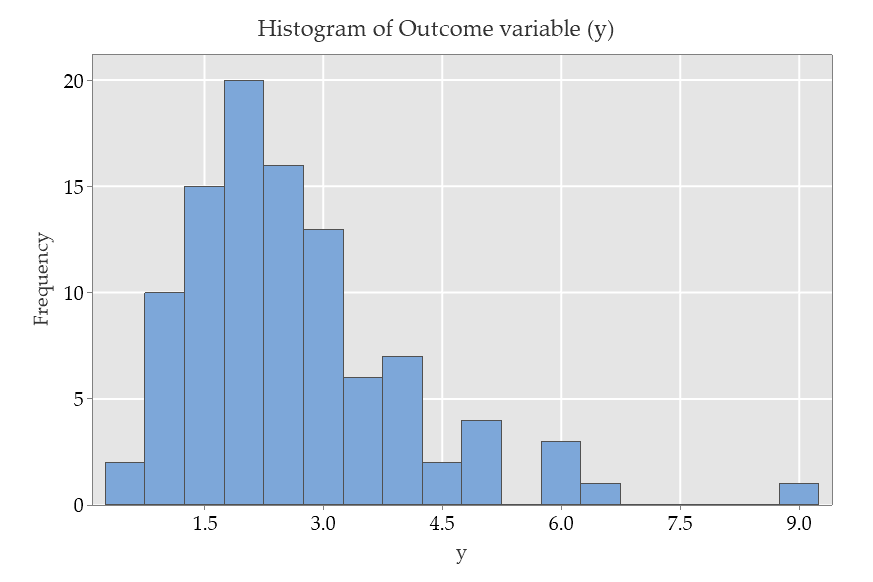 The distribution of the outcome (y) is quite skewed.
The scatterplot of y against x is shown below:
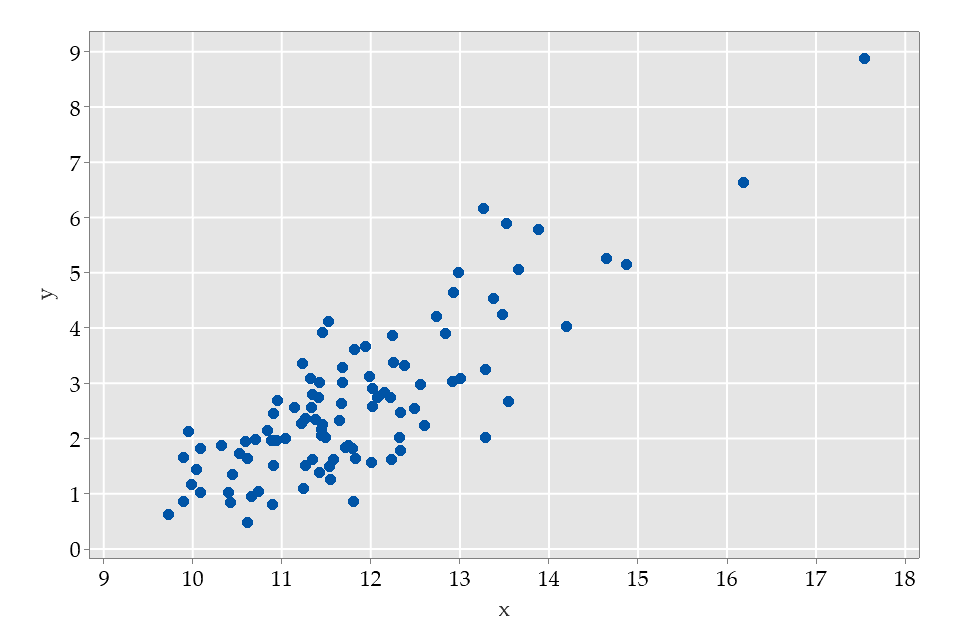
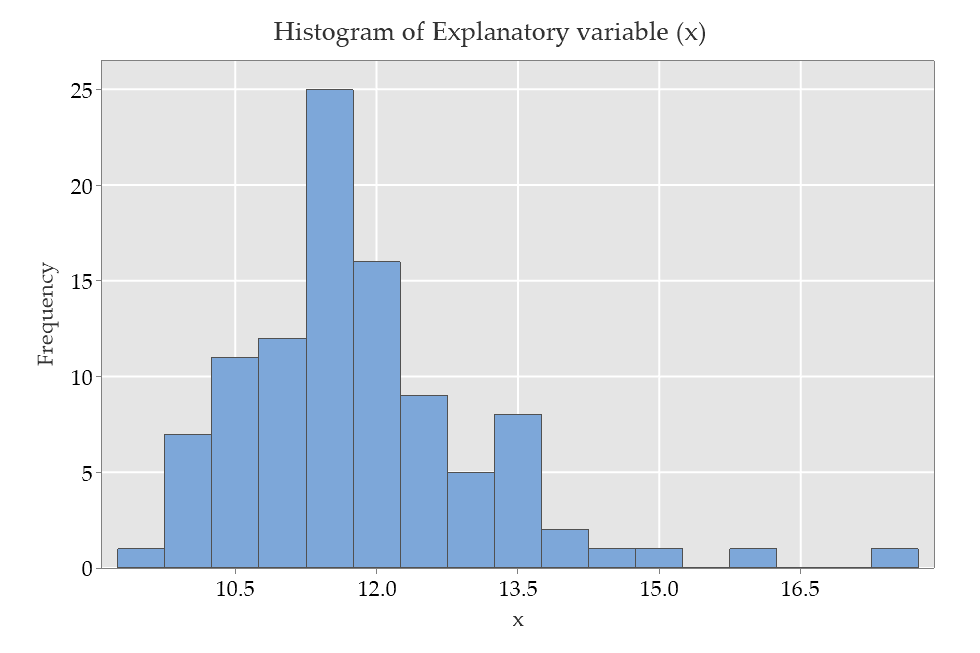
This suggests that a linear model would be quite reasonable. This is because the distribution of the explanatory variable is also skewed, as shown below. The extreme values in x tend to be associated with the extreme values in y. This simple simulated example illustrates how we need to think about the model, rather than "the distribution of data" in considering assumptions.
Constant variance
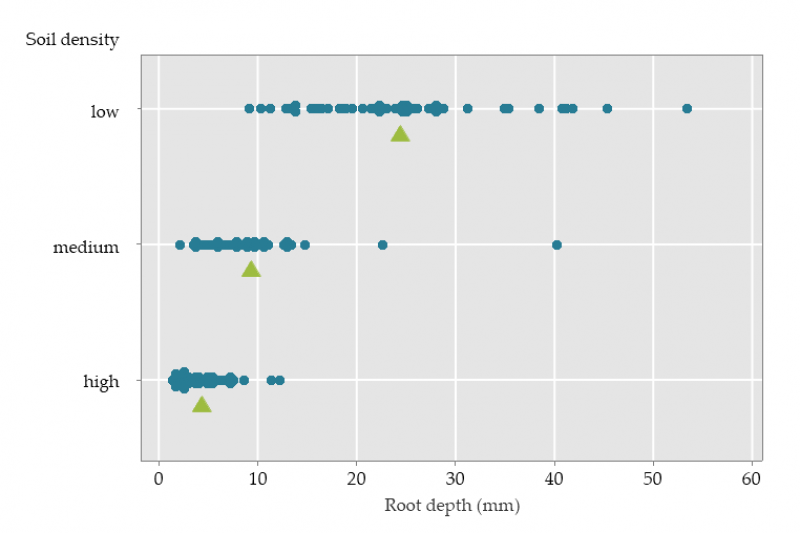
The assumption of constant variance means that the variability in deviations from the model should not depend on the model or the explanatory variables. The graph on the left shows the root depth (mm) of seedlings grown in soil of different density. The dots show the observations, and the triangles are the means in each soil density group.
We might consider analysing this experiment with a one-way analysis of variance. This model predicts the mean score for each group, so the deviations in each group are the differences between the mean and the observations. These deviations have increasing variability as we move from high to medium to low soil density. This is an undesirable feature, reflecting a violation of the assumption of constant variance. Inferences will be wrong, if the analysis assumes a constant variance. You can read more about dealing with violations of the assumption of constant variance in our upcoming post on Checking model assumptions.
Independence
This assumption matters most when it comes to using the right method of analysis for your data. To understand if this assumption is reasonable, we need to think about the design of your study and the structure of your data. That's why statisticians will ask you a lot about the background to your data, apart from their natural curiosity.
The assumption of independence of the random deviations will be reasonable if the observations themselves are independent; this means that there is no association between the observations.
There are many examples where observations are not independent. We can predict the weather tomorrow from the weather today - observations in time may not be independent. Observations in a "paired" study that measures blood pressure before and after exposure to a stressful stimulus are unlikely to be independent. Measurements of reading performance of grade 1 children in 10 different classes are unlikely to be independent - observations in clusters, like classrooms, are likely to be related. There are many methods of analysis for data where observations are not independent; however using one of the methods of analysis considered in this post (a linear model) is likely to be wrong.
In the root depth experiment above, we would need to ask - how were the seedlings grown? Were they grouped in pots? What environment were they grown in? Were they grouped in some other way that might affect their growth? If so, the observations might not be independent.
If you incorrectly assume independence, you are (wrongly) assuming that you have more information in the data than you do.
You can read more about the assumption of independence in our upcoming post on Checking model assumptions.
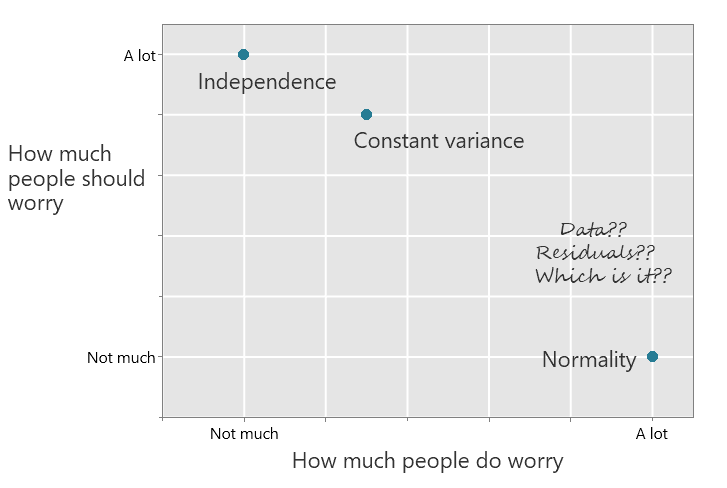
How much you should worry ...
We listed the assumptions in the order they should be prioritised: independence, constant variance, then Normality. Ironically the common emphasis given is the reverse order.