Growing better pinot noir
Introduction
Pinot noir is one of the oldest grapes grown for making wine. A good bottle of pinot noir can be difficult to produce. The grape vine is susceptible to frost, viruses and birds. The wine can ferment violently and uncontrollably in production, and the flavour depends on the “flavour of the soil”. Vincent Lakey was interested in using environmentally friendly treatments of the soil under pinot noir vines. He compared a standard herbicide with two greener alternatives: straw mulch and compost.
The key question Vincent wanted to answer was: Did the under vine treatment influence the vine yield and wine quality?
Timeline
-
- Autumn: Study design
- Winter: Under vine treatments applied. Data collection commences.
-
- Autumn: First grape harvest after treatment.
- Winter: First pruning after treatment.
- Spring: First treatment top up; vine growth monitored.
- Summer: First soil & leaf stalk samples collected.
-
- Autumn: Second grape harvest after treatment.
- Winter: Data analysis commences; second pruning after treatment.
- Spring: Vine growth monitored.
- Summer: Second soil & leaf stalk samples collected.
-
- Autumn: Third grape harvest after treatment.
- Winter: Third pruning after treatment; field trial ends.
Background
The vineyard
Vincent works with his family on the vineyard. It is about 40km north of Melbourne, south of the Macedon ranges. The pinot noir vines (D5V12 clone) were planted in 1987 and 1988.
The soil and, in particular, the organic matter in the soil can be easily damaged in the normal course of working the vineyard. Organic matter is important to the quality of the soil. The structure of the soil is also important. The structure is the shape that the soil takes (e.g. crumbly, clay-like, sandy) and it depends on the physical and chemical properties of the soil. For grape-growing, the soil should be able to hold water, efficiently release nutrients and also suppress the growth of weeds.
Setting up the trial
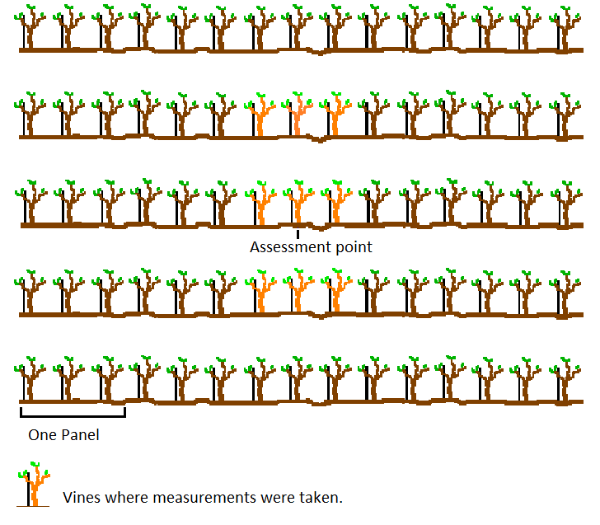
The study was set up on a four hectare block on the vineyard (one hectare is 100m by 100m). Each row in the vineyard includes 100 vines. The rows are 200 metres long with vines planted at 2 metre spacings. The rows are divided into sections 6 metres long called panels. Thus each panel includes 3 vines.
The study compared three under vine treatments – barley straw mulch, compost and a herbicide. Each treatment was applied to 6 adjacent rows of vines within a block.
Assessment points for collecting data about a variety of different outcomes were selected within blocks. Three things were considered in choosing the assessment points: they should not be too close to the edge, they should have the same type of soil, and trunk diameters (an indication of the vigour of the vine) should be similar. The figure on the right shows an assessment point within a block and the nine vines around the assessment point on which measurements were taken.
Applying the treatments
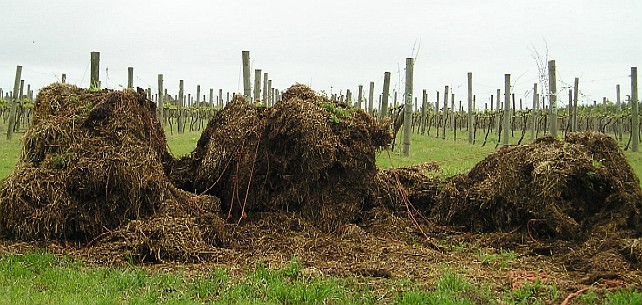
The barley straw mulch was applied to between 5cm and 10cm thick. A side-throw slasher was used to apply the straw under the vines. This mechanical method had the disadvantage of damaging the straw and, as a result, the straw broke down more rapidly than expected.
The compost (green garden waste) was also applied to between 5cm and 10cm thick. A hopper on a trailer with a conveyor belt placed a mound of compost under the vines.
The herbicide was applied to a half metre wide strip under the vines using a spray cart on a tractor. The herbicide used was “Basta” – a herbicide commonly used with genetically modified crops. Basta usually kills most green plants that have not been genetically modified.
Assessing the treatments
Vincent was interested in many different outcomes that might be affected by the use of different under vine treatments. It was possible that different treatments might have effects on different aspects of the whole grape growing and wine making cycle. The growth of the vine itself was assessed by measuring trunk diameter, and also by recording the growth stage of the vines at particular times. Characteristics of the vines were investigated by taking samples of the petioles; these are the stalks of the leaves.
They were sent for chemical analysis. Samples of soil were also sent for chemical analysis. Other characteristics of the soil, such as the amount of bacteria and fungus, were measured. Information was also collected about the grapes. The number and weight of bunches were recorded. When the grapes were juiced, the juice was analysed to investigate properties related to the flavour of the wine.
-
Vincent felt that it was important to monitor the growth of the vines as adding mulch to the soil can insulate it. This can delay the bud burst – the emergence of new green leaves from the canes. Addition of mulch sometimes can slow growth in the first season that the mulch is applied.
-
The petiole samples were collected in 2001 and again in 2002. Different laboratories analysed the samples in the different years, so the information available about the samples differs slightly from year to year. It is most appropriate to focus on comparisons of the under vine treatments within a given year.
Four important nutrients are sodium, magnesium, potassium and calcium. The amount of these nutrients in the petioles was measured. Standards are set for the percentage of each of the nutrients that are adequate for good leaf nutrition. For example, adequate calcium levels are between 1.2% and 2.5%; adequate magnesium levels are about 0.4%, and; adequate potassium levels are between 1.8% and 3%. For sodium, levels are regarded as toxic if they are above 0.5%.
-
The soil samples were collected in 2001 and again in 2002. As with the petiole samples, different laboratories analysed the samples in the different years, so it is most appropriate to focus on comparisons of the under vine treatments within a given year.
Soil characteristics are very important in grape growing. The introduction of organic materials such as compost or straw may have an effect on the composition of the soil. Ideally, the uptake of nutrients from the soil will be improved and other characteristics will not be adversely affected.
Vincent asked the analytical laboratories to assess various properties of the solid soil mass. High levels of chloride in the soil can indicate high soil salinity which can “burn” the plants. High levels of potassium in the soil can be absorbed by the plant and the skin of the grapes; this can leech into the wine and eventually form crystals. The phosphorus levels in the soil are related to the growth of the roots. The ratio of calcium to magnesium in the soil is an indicator of the soil’s “health”. If the ratio is very low (say less than 1), the soil can degrade. If the ratio is too high (say greater than 8), it can result in leeching of other nutrients.
The laboratory also measured the pH of calcium chloride in the soil. Acidity levels in the soil should not be too extreme and ideally would be between 5.5 and 6. Information about the nutrients in the water in the soil, including sodium, magnesium, potassium and calcium, was obtained. The nutrients in the water in the soil can be absorbed by the plant’s root system.
-
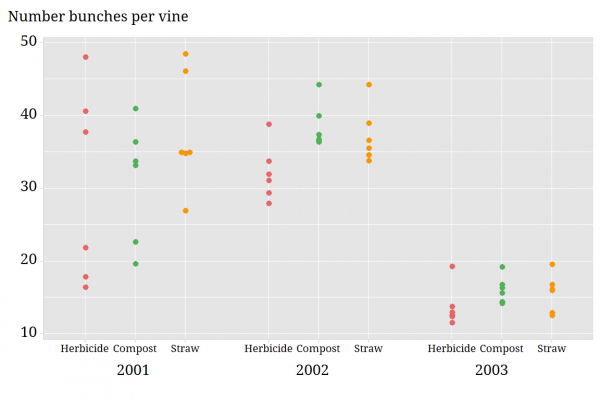
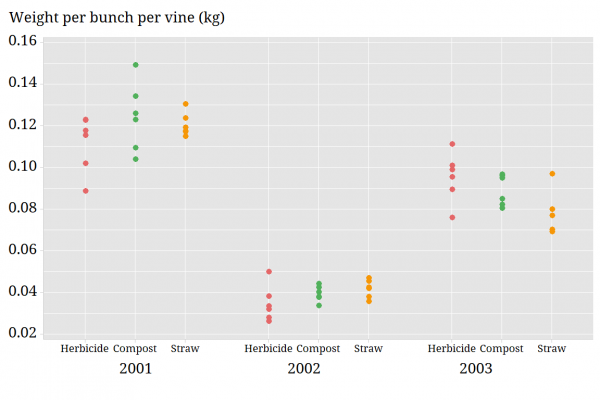
At harvest, Vincent measured the productivity of the wines in terms of how many bunches were produced and the yield of grapes from those bunches. Greater productivity is generally preferable as long as grape quality is sustained, and it was important to investigate the effects of the under vine treatments on yield. As mulch may affect growth in the first season of use, productivity may be reduced.
Use of herbicide reduces the competition of the vine with weeds, and the vines may be more productive than those with alternative treatments. However, “green” under vine treatments may enhance nutrition of the vines which might have a positive affect on productivity.
-
Characteristics of the juice are important to the flavour and other properties of the wine. Wine growers usually measure pH to determine the acidity of the juice. Acidity affects chemical reactions and characteristics (such as the colour) of the wine. Wine growers also measure the titration of tartaric acid. This affects the perception of the acidity of the wine on the tongue.
A lower acidity tends to give a better flavour balance, and the level of acidity can influence how sweet or dry the wine tastes. A third standard measure is Brix; it relates to the potential alcohol content of the wine. There are no absolute right or wrong values for these measures; what is appropriate depends on the type of wine desired.
Trials and tribulations
Field trials inevitably face some practical difficulties. Vincent seemed to have his fair share.
Vincent had wanted to collect information about the lengths of the shoots on the vines. However this proved to be impractical as the shoots and vines were damaged while trying to take the measurements.
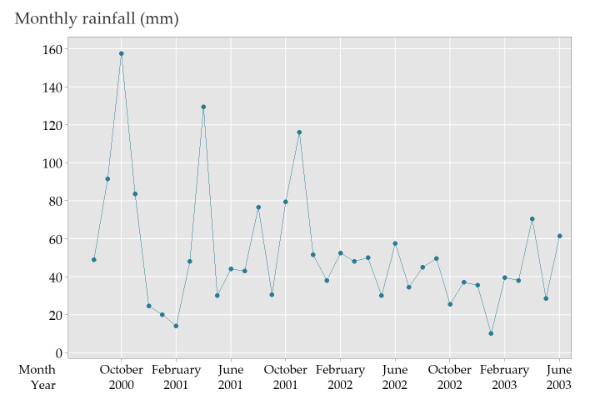
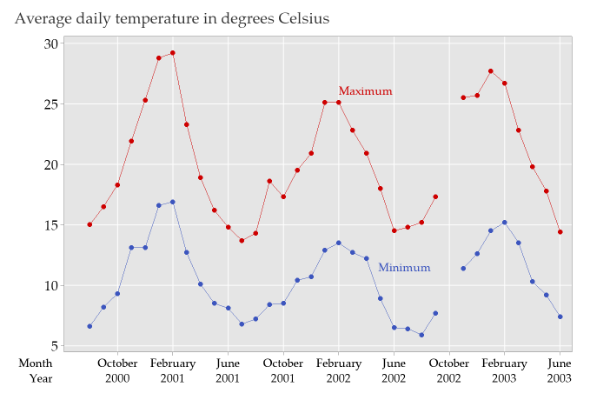
During the study, areas of Victoria were suffering from drought. In 2001-2003 rainfall in the vineyard was in the lowest 10% of recorded rainfall for the region. This is referred to as a serious deficiency in rainfall. In the vineyard in 2002, for example, 240mm of rain fell during the growing season compared with 476mm in the same period in 2000.
In late Spring 2002, the vineyard was grazed by sheep for three weeks. The drought conditions meant that fodder was in short supply for livestock. The first buds had burst on the vines and the sheep grazed over 70% of the buds. This meant that the yield depended more on the secondary buds which typically produce much less fruit. The effect of the sheep grazing the vineyard was like the effect of a major frost – substantial loss in fruit production.
Study design
Vincent’s study used six blocks laid out on the vineyard. There was one area on the north side of the vineyard and one area on the south side of the vineyard each divided into three east-west blocks. The same layout was used in each of the two areas (north and south), and each treatment was applied to six adjacent rows of vines.
Variables
-
- Trunk diameter
- Grapevine growth stage (See Data page for stage definitions)
-
- Dry weight of 1 gram of fresh soil
- Weight of active bacteria (micrograms per 1 gram of soil)
- Weight of active fungi (micrograms per 1 gram of soil)
- Ratio of calcium to magnesium
- soil pH (in calcium chloride solution)
- Soil chloride (milligrams per 1 kilogram of soil)
- Soil phosphorus (milligrams per 1 kilogram of soil)
- Soil potassium (milligrams per 1 kilogram of soil)
- Soluble calcium (milliequivalents per 1 kilogram of soil)
- Soluble magnesium (milliequivalents per 1 kilogram of soil)
- Soluble potassium (milliequivalents per 1 kilogram of soil)
- Soluble sodium (milliequivalents per 1 kilogram of soil)
-
- Calcium content (as a percentage of the dry matter of the stalk sample)
- Magnesium content (as a percentage of the dry matter of the stalk sample)
- Potassium content (as a percentage of the dry matter of the stalk sample)
- Sodium content (as a percentage of the dry matter of the stalk sample)
-
- Number of bunches harvested
- Weight of bunches harvested (kg)
- Weight of material removed at pruning (kg)
- pH of juice at crushing
- Titration of tartaric acid (to a pH of 8.2 in grams per litre)
- Brix – amount of soluble solids in the juice; the solids are mostly sugars
Data collection
-
Season Vineyard activity Data collection Spring Fortnightly spraying against Powdery mildew and Downey mildew.
Soil moisture monitored, irrigation if necessary.
Foliage wires adjusted to allow fruit development and control vine development.
Nutrients applied to soil if necessary.
Mulch & straw topped up, herbicide applied.Vine growth and soil moisture recorded. Summer Continue spraying against mildew.
Continue irrigation if necessary.
Continue to adjust foliage wires.
As berries colour and enlarge, protect bunches against birds and other pests.Soil and petiole samples collected.
Soil moisture recorded.Autumn Continue irrigation if necessary.
Continue to protect crop.
Sample fruit for tasting.
Grapes harvested.
Post-harvest irrigation and nutrient application if necessary.Harvest data collected.
Grapes juiced and fermented.
Juice analysis for pH , tartaric acid and Brix .
Juice and wine sample frozen for later analysis.Winter Vines pruned.
Soil preparation.
Trellis repairs.
Weed control.Pruning weights measured.
Trunk diameter measured. -
Measuring trunk diameter Trunk diameter was measured during winter when vines were dormant. The measurement was taken 200mm above the soil surface. The trunk diameter of every vine sampled was measured. Measuring vine growth In September and October of 2001 and 2002 vine growth was monitored. Vine growth was monitored on one cane from one of the nine vines at each assessment point. The cane was selected at random. The growth stage of ten nodes on the cane was recorded. As the vineyard was grazed by sheep in 2002, where a bud had been damaged or eaten, no data was collected. Taking soil samples At each assessment site, two sets of 6 samples of soil were taken. Soil was collected using an auger to a depth of 50mm below the surface. One set of samples was sent to a laboratory to look for bacteria and fungus. The other set was sent to another laboratory for nutrient analysis. In this analysis, for example, a “Skene” test for removing potassium from the solid soil with hydrochloric acid was used. The “Olsen” test for removing phosphorus from the solid soil with bicarbonate soda was used. Other tests assessed the nutrients contained in the water held in the soil. Taking petiole samples Petiole tissues were sampled when most of the vines were in flower. (Note that soil and petiole samples were taken at the same time.) From each vine, the stalk from the bottom leaf opposite the lowest bunch of grapes was taken. Measuring the yield One week before the grapes were harvest, the number of bunches of grapes on each vine was counted. These bunches were harvested, put in a marked bucket and then weighed; the weight was recorded in kilograms. Juicing grapes for analysis After weighing, the grapes from nine vines at each assessment point were crushed together using a small commercial crusher. A sample of the juice was taken to determine the pH, Titration of tartaric acid, and Brix. The analysis was carried out at the winery. Vincent used an electronic pH meter to find the pH of the juice and the titrable acidity. A refractometer was used to measure Brix. Measuring pruning weights Three months after the harvest, the vines were pruned. The vines had been pruned to a standard form before the experiment began. During the experiment, vines in the trial were pruned to leave two canes each with 10 nodes including two two-node spurs. The total weight of the prunings in kilograms was measured.
Problem: measuring trunk diameter
Find out about the problems Vincent had measuring drunk diameter.
Analysis
Summary
Vincent’s well-planned field study showed from some very strong effects from year to year. The number of bunches of grapes harvested and the yield per bunch were affected by the ongoing drought. In 2002 sheep grazed the vineyard and ate most of the first bud burst! In that year, the number of bunches produced and grape yield depended on the undervine treatment. However the location of the vines also had some effect on productivity. In 2003 the productivity of the vines, as measured by the number of bunches produced, was not strongly effected by the under vine treatments.
Questions to consider
-
- Consider the way that grapevine growth is measured. Using the measurement with all the stages included, describe the type of measurement scale used and the kind of analysis that would be most appropriate for describing the distribution of growth stage.
- Again, consider the way that grapevine growth is measured. If you use the Major stages only, what kind of analysis is most appropriate for describing the distribution of growth stages?
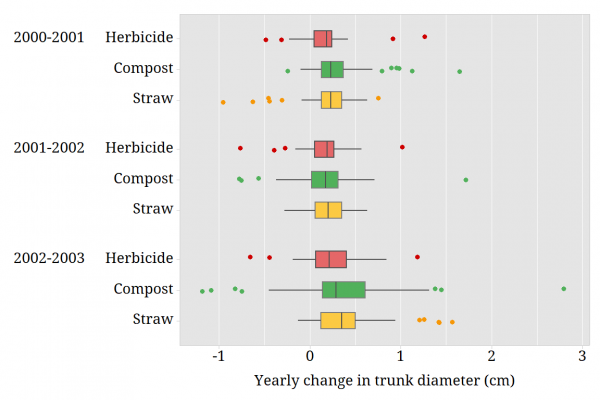
- Vincent had some practical problems in measuring the trunk diameter from year to year. You can hear about these problems on the Data collection page. Is there any evidence of such practical problems in the boxplots of yearly change in trunk diameter above? If there were practical problems in collecting these data, what recommendation would you make for the analysis? Explain why you made your preferred recommendation.
-
- Consider the study design. Write a short description of the design and explain any limitations you find. Propose an alternative design for the study.
- Vincent’s study was conducted during a drought. What effect do you think this has on his findings? What implications does it have for the inferences that he can make?
-
- Examine the data collected on trunk diameter over four years. The figure above shows the yearly change in trunk diameter. Describe the changes evident in the boxplot. Do the results make “common sense”? Explain why or why not.
- Examine the figure showing the yearly change in trunk diameter above. There are a number of unusual values in the data. What would you recommend doing with these unusual values? How would you justify your recommendation?
- Consider the soil analysis and the soluble nutrients in the water in the soil. Produce a visual representation characterising the relationships between the levels of the four nutrients.
-
- In the Background, some information about the levels of chloride, potassium and phosphorus in the soil, and the pH of calcium chloride in the soil was provided. Reasonable values for the ratio of calcium to magnesium were described. For a given year, investigate how the soil under the different treatments compares. Display the results of your analysis graphically, and include information about ideal or toxic levels of the soil characteristic when they are available.
- Investigate the claim that applying mulch under vines can delay growth, in particular bud burst.
- Consider each of the measures of the productivity of the wines in 2001. Investigate the effects of the undervine treatment on productivity. Consider what kind of contrasts you might make among the three treatments.
- Consider the juice analysis in any particular year. Investigate if organic under vine treatments differ from herbicide in their effect on characteristics of the juice.
-
- Many of the variables in the data set are based on the average of the observations from nine vines. What are the implications of this averaging for the data analysis and the inferences?
- In the Background, some standards for the levels of four different nutrients for ‘good leaf nutrition’ were described. Consider these standards and investigate if the petioles under each treatment had adequate nutrition (use results from either 2001 or 2002). Consider using (i) hypothesis testing and (ii) confidence intervals to investigate petiole nutrition. Would one approach be preferable? Explain why or why not.
Data
The data file includes six worksheets.
- The data sheet describing trunk diameter gives results for individual vines.
- In the other data sheets, there are 18 cases corresponding to the treatment and block combinations.
- Juice analysis data are based on the juice of all grapes from the 9 vines in each treatment and block combination crushed together.
- Soil sample data are based on 6 soil samples in each treatment and block combination pooled together.
- Petiole samples were also pooled for each treatment and block combination.
- On the remaining data sheets, the data from the 9 vines in each treatment and block combination have been averaged.
Definition of variables
-
Treatment Under soil treatment 1 = Herbicide 2 = Compost 3 = Straw EWblock Blocking from East to West on the vineyard 1 = East West block 1 2 = East West block 2 3 = East West block 3 Aspect North or south aspect of the vineyard 1 = North 2 = South Block Block (East-West block and Aspect) 1= East West block 1 – South side 2 = East West block 1 – North side 3 = East West block 2 – South side 4 = East West block 2 – North side 5 = East West block 3 – South side 6 = East West block 3 – North side -
Mean Vine growth stage, 15 September 2001 Mean Vine growth stage, 22 September 2001 Mean Vine growth stage, 29 September 2001 Mean Vine growth stage, 6 October 2001 Mean Vine growth stage, 20 September 2002 Mean Vine growth stage, 27 September 2002 Grapevine Growth stages
Shoot and inforescence development
Stage Number Stage Name Major Stage 1 Budswell 2 Winter bud 3 Woolly bud – brown wool visible 4 Green tip – first leaf visible Budburst 5 Rosette of leaf tips visible 7 First leaf separated from shoot tip 9 2-3 leaves separated; shoots 2-4cm long 11 4 leaves separated 12 5 leaves separated; shoots about 10cm long; inflorescence clear Shoots 10cm 13 6 leaves separated 14 7 leaves separated 15 8 leaves separated; shoot elongating rapidly; single flowers in compact groups 16 10 leaves separated 17 12 leaves separated; inflorescence well developed; single flowers separated 18 14 leaves separated; flower caps still in place, but cap colour fading from green Flowering
Stage Number Stage Name Major Stage 19 About 16 leaves separated; beginning of flowering Flowering begins 20 10% caps off 21 30% caps off 23 17-20 leaves separated; 50% caps off Full bloom 25 80% caps off 26 Cap-fall complete Berry development
Stage Number Stage Name Major Stage 27 Setting; young berries enlarging, bunch at right angles to stem Setting 29 Berries pepper-corn size; bunches tending downwards 31 Berries pea-size (7mm diameter) Berries pea size 32 Beginning of bunch closure; berries touching (if bunches are tight) 33 Berries still hard and green Ripening
Stage Number Stage Name Major Stage 34 Berries begin to soften; Brix starts increasing 35 Berries begin to colour and enlarge Veraison 36 Berries with intermediate Brix values 37 Berries not quite ripe 38 Berries harvest-ripe Harvest 39 Berries over-ripe Senescence
Stage Number Stage Name Major Stage 41 After harves; cane maturation complete 43 Beginning of leaf fall 47 End of leaf fall -
Brix of juice (2001 harvest) Brix of juice (2002 harvest) Brix of juice (2003 harvest) pH of juice (2001 harvest) pH of juice (2002 harvest) pH of juice (2003 harvest) Titration of tartaric acid in juice (2001 harvest) Titration of tartaric acid in juice (2002 harvest) Titration of tartaric acid in juice (2003 harvest) -
Number of bunches harvested per vine (2001 harvest) Number of bunches harvested per vine (2002 harvest) Number of bunches harvested per vine (2003 harvest) Weight of bunches harvested per vine in kg (2001 harvest) Weight of bunches harvested per vine in kg (2002 harvest) Weight of bunches harvested per vine in kg (2003 harvest) Weight of material pruned per vine in kg (2001) Weight of material pruned per vine in kg (2002) Weight of material pruned per vine in kg (2003) -
Dry weight 01 Dry weight of 1 gram of fresh soil (in grams) (2001) Dry weight 02 Dry weight of 1 gram of fresh soil (in grams) (2002) Bacteria 01 Weight of active bacteria in micrograms per 1 gram of soil (2001) Bacteria 02 Weight of active bacteria in micrograms per 1 gram of soil (2002) Fungi 01 Weight of active fungus in micrograms per 1 gram of soil (2001) Fungi 02 Weight of active fungus in micrograms per 1 gram of soil (2002) Ca/Mg ratio 01 Calcium to magnesium ratio in the soil (2001) Ca/Mg ratio 02 Calcium to magnesium ratio in the soil (2002) pH CaCl 01 pH of the soil (in calcium chloride solution) (2001) pH CaCl 02 pH of the soil (in calcium chloride solution) (2002) Soil chloride 01 Amount of chloride in the soil in milligrams per kilogram (2001) Soil chloride 02 Amount of chloride in the soil in milligrams per kilogram (2002) Soil phosphorus 01 Amount of phosphorus in the soil in milligrams per kilogram (2001) Soil phosphorus 02 Amount of phosphorus in the soil in milligrams per kilogram (2002) Soil potassium 01 Amount of potassium in the soil in milligrams per kilogram (2001) Soil potassium 02 Amount of potassium in the soil in milligrams per kilogram (2002) Soluble calcium 01 Amount of calcium in the water contained in the soil in milliequivalents per kilogram (2001) Soluble calcium 02 Amount of calcium in the water contained in the soil in milliequivalents per kilogram (2002) Soluble magnesium 01 Amount of magnesium in the water contained in the soil in milliequivalents per kilogram (2001) Soluble magnesium 02 Amount of magnesium in the water contained in the soil in milliequivalents per kilogram (2002) Soluble potassium 01 Amount of potassium in the water contained in the soil in milliequivalents per kilogram (2001) Soluble potassium 02 Amount of potassium in the water contained in the soil in milliequivalents per kilogram (2002) Soluble sodium 01 Amount of sodium in the water contained in the soil in milliequivalents per kilogram (2001) Soluble sodium 02 Amount of sodium in the water contained in the soil in milliequivalents per kilogram (2002) -
Calcium01 Percentage of calcium contained in the dry matter of the petiole (2001) Calcium02 Percentage of calcium contained in the dry matter of the petiole (2002) Magnesium01 Percentage of magnesium contained in the dry matter of the petiole (2001) Magnesium02 Percentage of magnesium contained in the dry matter of the petiole (2002) Potassium01 Percentage of potassium contained in the dry matter of the petiole (2001) Potassium02 Percentage of potassium contained in the dry matter of the petiole (2002) Sodium01 Percentage of sodium contained in the dry matter of the petiole (2001) Sodium02 Percentage of sodium contained in the dry matter of the petiole (2002) -
Row Row number in the vineyard Panel Panel number in the row Vine Vine number in the panel Trunk diameter in 2000 (cm) Trunk diameter in 2001 (cm) Trunk diameter in 2002 (cm) Trunk diameter in 2003 (cm)
Glossary
auger
A tool for boring a core of earth from the soil.
Brix (pronounced “bricks”)
A measure of the amount of soluble sugars in the juice. As most of the solids are sugars, it gives an index of how sugary the juice is. One degree of brix means there is about 1% sugar in the juice.
CEC (Cation Exchange Capacity)
This property of the soil is the capacity to hold and exchange nutrients (technically, positively charged ions). CEC gives an indication of the soil’s inherent fertility. Low CEC, for example, suggests limited capacity to hold nutrients and limited availability of nutrients. CEC is measured in milliequivalents.
petiole
Stalk of the leaf attached to the stem of the plant.
pH
A measure of acidity. Formally, pH is the concentration of hydrogen ions. pH is measured on a logarithmic scale; a value of 7 is neutral, values less than 7 indicate acidity and values more than 7 indicate a base.
refractometer
An optical instrument for measuring how much light bends in the juice. The degree to which the light bends depends on the amount of soluble solids in the juice; the instrument gives the amount of bend on the Brix scale.
tartaric acid
The primary natural acid in grapes. It is important to the flavour of the wine, to maintaining the colour of the wine, and also to preservation.
titration
A process for finding the concentration of a substance in a solution. In this case the concentration of tartaric acid in the juice is determined. It can be measured in percentage by volume or grams per litre.