Dr Jeremy Silver
Statistical Consultant

Consulting
I joined the Statistical Consulting Centre in 2023. I have undertaken longer consulting projects for State and Federal government agencies, including the Bureau of Meteorology and the CSIRO. I am interested in the intersection between statistical and deterministic modelling, and the interface between environment and health. I have experience in high-performance computing and scientific programming.
I am skilled at producing high-quality graphics (especially mapping and geographical datasets), reproducible data-analytic methods, and the application of statistical through to machine-learning models. I have strong expertise working with environmental data in particular.
I have consulted to dozens of graduate research students and academics within the University of Melbourne, and led a number of consulting projects for external clients across a range of industries.
Examples
Here are some examples of my consulting work.
- Development of a predictive model for spatiotemporal variation in an environmental allergen
- Projections of future metropolitan water resource requirements under climate change and population growth
- Machine-learning survival analysis in high-dimensional clinical trial data
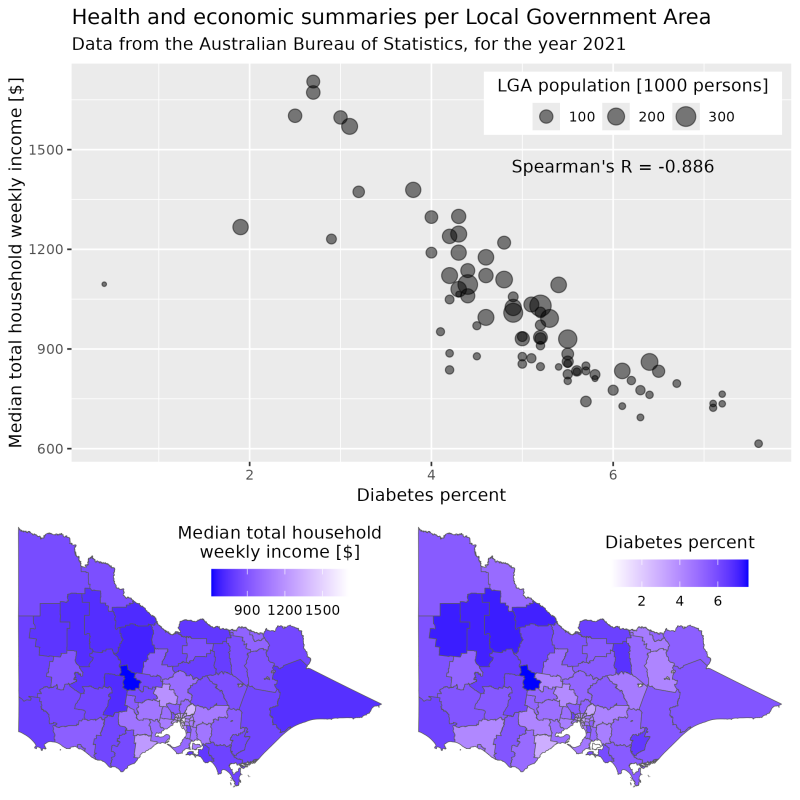
I love how graphs can tell a story.
This one, based on ABS summaries, shows how population health can reflect socioeconomic factors. The scatterplot is scaled by the number of people in each region; we see that the outlier on the far left of the upper panel is a much smaller sampler size, so the deviation of this point from the trend is likely a sampling artefact.
Looking beyond this example, please get in touch is us for help with translating your research into high-quality graphics.
Research
I studied applied mathematics and statistics at the University of Melbourne, and later undertook a PhD at Aarhus University, Denmark. There I studied statistical methods for combining satellite data and air pollution models. I joined the University of Melbourne in 2015 as a postdoctoral research fellow modelling environmental exposure (for airborne allergens and air pollution). My experience in applied statistics spans environmental modelling, biostatistics and bioinformatics.
I have co-authored over 60 peer-reviewed research articles or conference proceedings, and have an H-index of 25.
Resources
My colleagues and I in the Statistical Consulting Centre have developed free resources to help with understanding statistics and data analytics.
Here, for example, is some guidance for thinking about reproducible analysis: Reproducible analysis
Teaching
Statistical Consulting Centre short courses
The Statistical Consulting Centre offers intensive short courses open to anyone. Find out about Statistical Consulting Centre courses here. I tutor in the Centre’s Statistics for Research Workers using R and RMarkdown.
Contact
Jeremy.silver@unimelb.edu.au
(03) 8344 1660
Find an Expert