Analysis and data
Summary
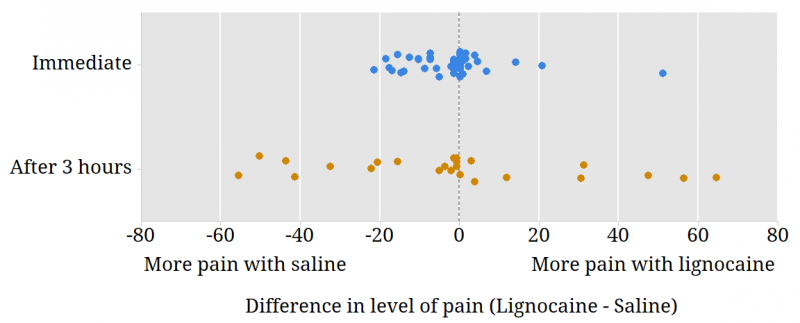
Fifty-one people participated in the study and all provided ratings of the pain experienced during the extraction. However, pain ratings 3 hours after surgery were only collected from patients in the first half of the trial; data were available for 25 patients.
There was a tendency for people to experience more pain on the saline side during extraction. Three hours after surgery, the differences in the pain experienced were highly variable; some people had more pain on the lignocaine side and others had more pain on the saline side. This can be seen in the figure above.
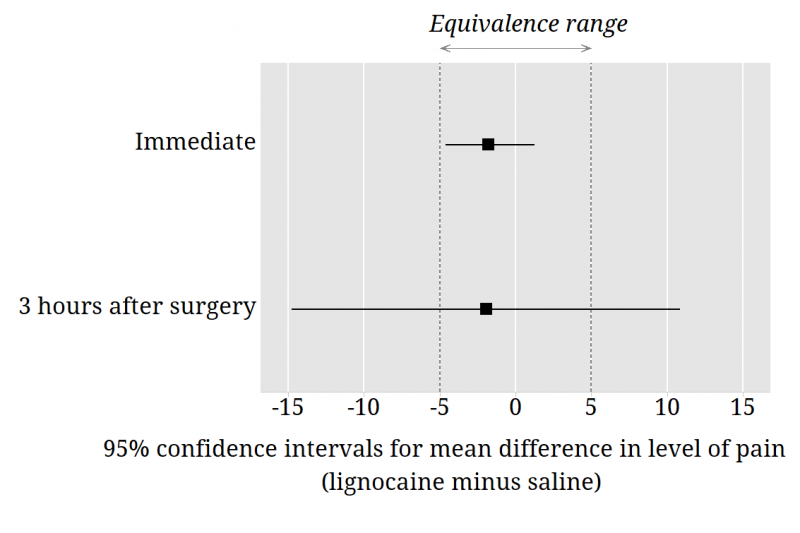
The wide 95% confidence interval for the mean difference in the level of pain experienced after 3 hours means that estimation of this difference is imprecise. The confidence interval is wide because there was large variability in the differences in the pain ratings after 3 hours and also because there were only 25 patients who provided the 3-hour ratings.
The confidence interval for the difference in pain rating during extraction is inside the equivalence range; we can consider the treatments to be equivalent. This confidence interval was obtained using bootstrap methods.
Questions to consider
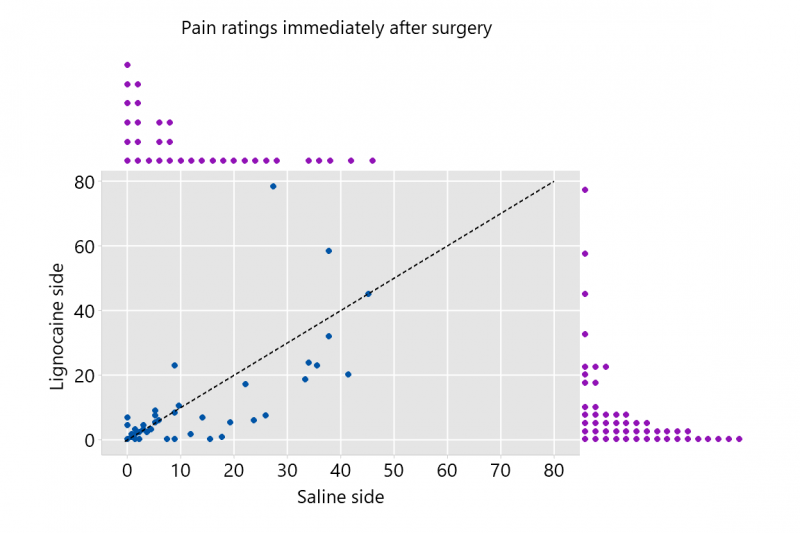
- The marginal plot to the left shows the ratings of pain on each side immediately after surgery. The dotted black line on the plot is the line y = x. Write an explanation of what the plot shows that could be understood by someone who is unfamiliar with statistics.
- Examine the differences in the pain reported under different treatments during surgery. Describe the features of the data.
- Consider the hypothesis that there is no difference in the pain reported under different treatments during surgery. Investigate different procedures for examining this hypothesis. Given the characteristics of the data, which approach would you recommend?
- Describe the differences in the pain reported under different treatments 3 hours post-surgery.
- Find a 95% confidence interval for the difference in reported pain under the two treatments 3 hours post-surgery. Describe the differences in the level of pain that patients report.
- Consider the patients’ guesses of what was injected in the lignocaine side. Find a 95% confidence interval for the proportion correct. Describe the accuracy of the patients guesses. Examine both the immediate and 3 hours post-surgery guesses.
- Investigate the relationship between the side receiving lignocaine and the side considered more comfortable during the 3 hours post-surgery.
- Consider the main outcomes for the study. What do the data suggest about Mark Badcock’s idea?
Definition of variables in data file
| Side receiving Lignocaine | Side of mouth receiving lignocaine treatment |
|---|---|
| VAS lignocaine during extraction | Visual analogue score for the lignocaine side during extraction |
| VAS lignocaine 3 hours later | Visual analogue score for the lignocaine side 3 hours after surgery |
| VAS saline during extraction | Visual analogue score for the saline side during extraction |
| VAS saline 3 hours later | Visual analogue score for the saline side 3 hours after surgery |
| More comfortable side | More comfortable side during 3 hours after surgery |
| Guess lignocaine side immediate | Patient’s guess of what was injected in the lignocaine side (immediate post-surgery) |
| Guess lignocaine side 3 hours later | Patient’s guess of what was injected in the lignocaine side (3 hours post-surgery) |