Colour vision
Introduction
What colours are seen by people with abnormal colour vision?
Some people have difficulty perceiving colours correctly. Colour is used widely today as a means of encoding information. In some occupations, such as flying aircraft, the recognition of colours on electrical devices is important. For this reason, much is known about how accurately people recognise colours on such devices. However, little is known about the perception of surface colours, like those displayed on computer screens.
Professor Barry Cole and his colleagues, Ka-Yee Lian and Carol Lakkis, were interested in learning more about this so that the design of colour-coded displays could be improved. They collaborated with statistician Dr Ken Sharpe on this project.
The key question was: How accurately can people with abnormal colour vision name surface colours?
Background

Clinical vision tests
Four clinical vision tests were used. These were the Ishihara test, the Farnsworth D15 test, the Richmond HRR test and a test using the Type I Nagel anomaloscope. The results of the four clinical colour vision tests were used together to identify the type of colour vision deficiency each participant had. All participants were classified as having one of six colour vision deficiencies.
Reduced or impaired sensitivity to the green end of the spectrum:
- Deuteranomaly (Mild)
- Deuteranomaly (Moderate)
- Deuteranopia (Severe)
Reduced or impaired sensitivity to the red end of the spectrum:
- Protanomaly (Mild)
- Protanomaly (Moderate)
- Protanopia (Severe)
See the Glossary for more details of these impairments.
-
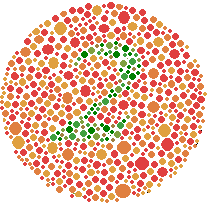
The Ishihara test for colour vision deficiency is relatively well-known. It was first published by a Japanese academic, Dr. Shinobu Ishihara, in 1917. It is made up of a series of images of circles. Each circle contains a large number of different sized and different coloured dots. Some dots are coloured in such a way to distinguish a number. Colour blind people may not be able to see the number or may see a number different from that seen by people with normal vision. The Ishihara test does not have images to detect "blue-yellow" colour vision deficiencies.
-
The Farnsworth D15 test uses 16 coloured disks that make up a complete colour circle. A tester places the first reference disk down and then asks the person being tested to place down the next closest colour. They are then asked to put down the next closest colour, and so on, until all the disks are placed in a line. A person with colour vision deficiency will place the disks in an order that is different from the order used by people with no deficiency. The particular order of the disks can be used to diagnose the type of colour vision deficiency. The Farnsworth D15 can also be used to classify the degree of colour vision deficiency.

-
The Richmond Hardy-Rand-Rittler (HRR) test, like the Ishihara test, is made up of a series of images created from patterns of dots. The Richmond HRR test has simple symbols, rather than numbers, encoded in colour within the image.
When the test is used with adults, they are asked to trace the symbol in the image with a camel's hair brush. There are four practice images, and 20 test images.
Adults who get the first 6 test images correct have normal colour vision; the pattern of errors (if any) on the set of test images can be used to diagnose the nature of the colour vision deficiency.
-
The Nagel anomaloscope is an optical instrument that a person looks into to see a coloured circle. The top and bottom halves of the circle are coloured differently, and the observer's task is to adjust two knobs to make the bottom half of the circle match the top half in colour and brightness.
The two controls on the anomaloscope allow the observer to adjust the amount of yellow light, and the ratio of red to green. The type of colour vision deficiency (if any) can be diagnosed from the way adjustments are made.
Colour naming task
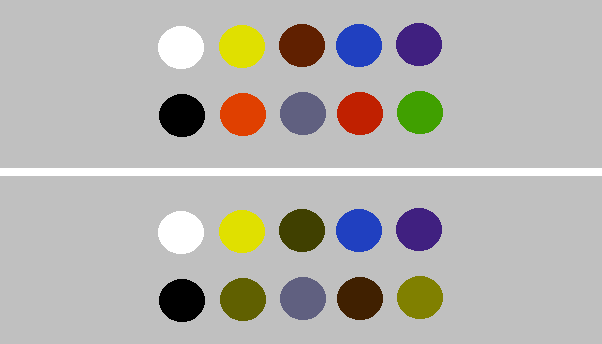
The colour naming task was developed especially for this study. It was devised to test people's ability to name ten different surface colours correctly. The colours were red, orange, brown, yellow, green, blue, purple, white, grey and black. A group of experimenters with normal colour vision chose the colours so that they were an unambiguous instance of the colour they wished to test.
The colour naming task used 6 A4 cards with the ten colours. The colours were displayed in different ways on each card; three cards used dots with diameters of 17mm, 7mm and 1.9mm. The other three cards used 20mm lines which were 3.5mm, 1.9mm and 1mm wide. The number of errors made out of 10 was recorded for each card. Participants judged each card twice.
Publication
In 2006, a paper describing the study's findings was published:
Cole, B. L., Lian, K. Y., Sharpe, K., & Lakkis, C. (2006). Categorical color naming of surface color codes by people with abnormal color vision. Optometry and Vision Science, 83(12), 879-886.
The publication includes a group of 20 participants with normal colour vision but these were not the main focus of analysis; these are not considered in the data provided here.
Study design
Statistician’s description of study design
The study is an observational one.
Various measures of clinical vision were taken to classify participants into groups. Participants' performance on a colour naming task was measured to allow a comparison of the groups.
Performance was measured under 6 different conditions corresponding to six different ways of presenting the colours (dots 17mm, 7mm or 1.9mm in diameter or lines 3.5mm, 1.9mm or 1mm wide).
In each condition, participants judged the set of colours twice; in the second sets of judgements the cards were inverted.
There were two orders of presentation of the task: (dots, lines, lines, dots) and (lines, dots, dots, lines).
Variables measured
- Participants were classified into one of six groups, according to their performance on four clinical vision tests:
- Deuteranomaly (Mild)
- Protanomaly (Mild)
- Deuteranomaly (Moderate)
- Protanomaly (Moderate)
- Deuteranopia (Severe)
- Protanopia (Severe)
- For each of the different test conditions, the number of errors in colour naming was recorded; there were 20 trials for each of the conditions:
- dots 17mm diameter
- dots 7mm diameter
- dots 1.9mm diameter
- lines 3.5mm wide
- lines 1.9mm wide
- lines 1mm wide
Protocol
| Participant recruitment | Patients attending the colour vision clinic of the Victorian College of Optometry were invited to participate in the study. Ninety-nine out of one hundred consecutive patients participated; one child did not complete all the tests and was excluded. |
|---|---|
| Clinical vision tests | The four clinical vision tests were administered first. These were the Ishihara test, the Farnsworth D15 test, the Richmond HRR test and the Type I Nagel anomaloscope . The tests are described in detail in the Introduction. |
| Colour naming task | Participants were provided with a list of 10 colour names. They were presented with the colour cards, one at a time and asked to name the ten colours using the list provided. Dot cards and line cards were presented from largest to smallest for all participants. Half the participants judged the cards with dots first; the other half judged the cards with lines first. All participants judged the set of six cards twice; in the second set of judgements, the cards were inverted (to change the order of the colours) and the order of the dots and lines was reversed. The testing conditions ensured that participants viewed the cards on the same stand, at the same distance and under the same illumination conditions. Participants had up to 2 seconds to name each colour. |
Summary
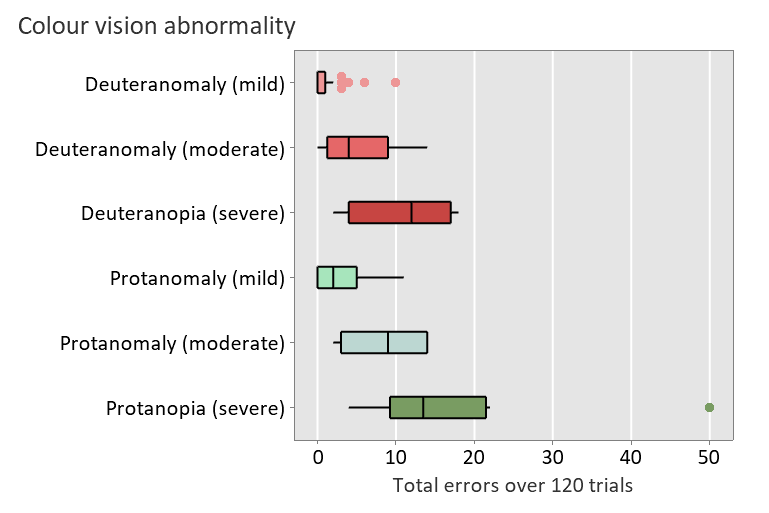
The researchers found that 37% of people with colour vision deficiency in their study were able to name all the colours on all the cards correctly.
The proportion of errors made depended on the type of colour vision deficiency as well as on characteristics of the stimulus used.
The figure to the right shows boxplots of the total number of errors over 120 trials by type of colour vision deficiency. It suggests increasing errors with increasing severity of the colour vision deficiency, and also highlights some differences in the variation of total errors for the different groups.
Questions to consider
- Construct a visual display to show the proportion of errors made by people with different types of colour vision deficiency. Display the results according to the type of stimulus used (lines or dots of varying sizes).
- Consider making a simple pairwise comparison between the two severe groups (Deuteranope and Protanope). Use an appropriate method to compare the proportion of participants making no errors.
- Again consider making a simple pairwise comparison between the two severe groups (Deuteranope and Protanope). Use an appropriate method to find a confidence interval for the difference in the proportion of participants making no errors.
- Find the total number of errors made by each participant and display the data graphically. Use a suitable method to compare the groups on this outcome. Characterise the differences between the groups.
- Model the proportion of errors made in terms of clinical vision deficiency, type and size of stimulus. Characterise the important explanatory variables in terms of odds ratios and confidence intervals.
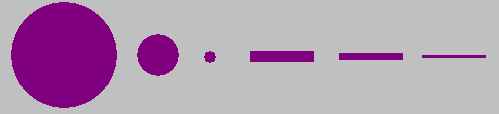
- The figure below shows the six different types of stimulus used. Consider ways of calculating an equivalent measure of stimulus size for both dots and lines. Include your preferred measure of stimulus size as an explanatory variable in a model of the proportion of errors made by people with different types of clinical vision deficiency.
Definitions of variables in data file
| Column | Definition |
|---|---|
| Participant | Participant number |
| Colour vision abnormality | Type of colour vision abnormality |
| Dots17 | Number of errors in naming colours of 17mm dots |
| Dots7 | Number of errors in naming colours of 7mm dots |
| Dots1.9 | Number of errors in naming colours of 1.9mm dots |
| Lines3.5 | Number of errors in naming colours of lines 3.5mm wide |
| Lines1.9 | Number of errors in naming colours of lines 1.9mm wide |
| Lines1 | Number of errors in naming colours of lines 1mm wide |
Glossary
Anomalous trichromats
People with problems seeing and distinguishing colours in the same ways as those with normal vision; they can have deuteranomaly or protoanomaly.
Colour blindness
A term referring to colour vision deficiency.
Colour vision deficiency
Difficulty with seeing differences between (some or all) colours that other people can see. Also sometimes referred to as colour blindness.
Cones
The three types of cone cells in the retina of the eye absorb light from different parts of the spectrum and hence allow us to perceive colour.
Dichromats
People how cannot see some hues in the spectrum; one of their three types of cone cells is dysfunctional.
Deuteranomaly (Mild)
A colour vision deficiency where there is a reduction in sensitivity to the green end of the spectrum.
Deuteranomaly (Moderate)
A colour vision deficiency where there is a reduction in sensitivity to the green end of the spectrum.
Deuteranopia (Severe)
A colour vision deficiency where cones sensitive to green end of the spectrum are missing. Like protanopes, deuteranopes have difficulty perceiving red-green hues.
Protanomaly (Mild)
A colour vision deficiency where there is a reduction in sensitivity to the red end of the spectrum.
Protanomaly (Moderate)
A colour vision deficiency where there is a reduction in sensitivity to the red end of the spectrum.
Protanopia (Severe)
A colour vision deficiency where cones sensitive to red end of the spectrum are missing. Protanopes have difficulty perceiving red-green hues.
Trichromats
People with normal colour vision.