Music therapy for the terminally ill
Introduction
Music therapists use music as a treatment aimed at promoting good health and well-being. People respond to music in a wide variety of ways; responses can be physical, emotional or cognitive. Music therapists use both live and recorded music to facilitate change and well-being. Anne Horne-Thompson is a music therapist who works with people with terminal illnesses.
The key question Anne wanted to answer was:
Can music therapy reduce anxiety in terminally ill patients?

Timeline
- 2003
-
Study design and ethics approval.
- March 2004
-
Data collection commences.
- March 2005
-
Data collection completed and Data analysis commences.
Background
Anne is a clinician at Calvary Health Care Bethlehem; patients are referred for music therapy by doctors, nurses and allied health staff. A common reason for the referral was that the patient was anxious. In Anne’s clinical experience, music therapy was very effective in helping reduce anxiety in terminally ill patients. Anne designed her study to collect empirical evidence on the effect of music therapy. She compared a music therapy treatment with a control treatment. Patients were randomly assigned to receive one of the two treatments.
Music therapy treatment
The music therapy treatment was tailored for each patient. Anne worked with each patient to decide what kind of activities and interaction would be most appropriate. The music therapy included relaxation to music, listening to recorded music, singing and playing familiar music.
Control treatment
The control treatment was a single session with a volunteer from the hospital. The volunteer spent time with the patient discussing things of interest or importance to the patient. The volunteer had an empathetic and supportive role.
Measurement Instruments
Eastern Cooperative Oncology Group performance status
This measure is designed to indicate the degree of disease progression in a patient and evaluates his or her capacity to carry out activities of daily living, including the capacity to work and to care for oneself.
The scale has six levels
0 Fully active and able to carry out activities of daily living
1 Mobile and able to carry out light activities, including light work
2 Mobile, able to care for oneself but unable to work
3 Limited capacity to care for oneself; in a chair or bed for more than half the waking hours
4 Unable to care for oneself; in a chair or bed for the waking hours
5 Deceased
Behavioural Observation Checklist
Anne developed this instrument for her study. She worked with other professionals working with patients in palliative care to devise a list of behaviours that could relate to underlying anxiety in these patients. The final checklist had 15 behaviours, such as shivering, muscle tensing, irritability and nausea. Health care professionals rated 14 of the 15 items on a scale from 1, indicating ‘not at all’ to 5, indicating ‘extreme’. Patients were asked to rate their nausea on the same scale.
Edmonton Symptom Assessment System
The Edmonton Symptom Assessment System was used to assess nine different symptoms in patients in palliative care. The patients were asked to describe the intensity of each symptom on a visual analogue scale (VAS); Anne provided a scale with markings from 0 to 10. The VAS was 10cm long, so Anne measured the length of the scale to the mark made by the patient. Higher scores indicated higher intensity for a symptom.
The symptoms assessed were pain, tiredness, nausea, depression, anxiousness, drowsiness, appetite, well-being, and shortness of breath.
Pulse oximeter
The patient’s heart rate was measured using a pulse oximeter. This is an instrument that clips to the patient’s finger (for example) and provides a read-out of his or her heart rate.
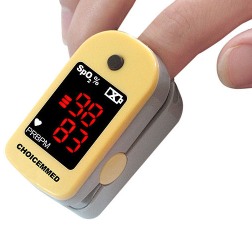
Pulse oximeter attached to the finger.
References
Bruera, E., Kuehn, N., Miller, M., Selmser, P., Macmillan, K. (1991) The Edmonton symptom assessment system (ESAS): a simple method for the assessment of palliative care patients. Journal of Palliative Care, 7(2), 6-9.
Oken, M., Creech, R., Tormey, D., Horton, J., Davis, T., McFadden, E., Carbone, P. (1982) Toxicity and response criteria of the Eastern Cooperative Oncology Group. American Journal of Clinical Oncology, 5, 649-655.
Study Design
Interventions
- Control treatment
- Music therapy
Variables measured
Immediately before treatment
- Heart rate
- Ratings of 9 symptoms on the Edmonton Symptom Assessment System
- Behavioural Observation Checklist
Immediately after treatment
- Heart rate
- Ratings of 9 symptoms on the Edmonton Symptom Assessment System
- Behavioural Observation Checklist

Other information recorded
- Gender
- Eastern Cooperative Oncology Group performance status
- Duration of treatment
Statistician’s description of the design
The study was a randomised controlled trial. Terminally ill patients were randomly assigned to receive a standard intervention or music therapy.
Calculating the power of the study
When planning the study, Anne thought it was feasible to obtain 30 patients in her control group and 30 patients in her music therapy group. The power of detecting various differences between the two groups was based on 30 participants in each.
Anne hoped to find a greater change in anxiety in the music therapy group compared with the control group. Her primary outcome of interest was the change in anxiety measured by the Edmonton Symptom Assessment System (ESAS) from before to after an intervention. To estimate the power, an estimate of the standard deviation of the change in ESAS anxiety score was needed. Some previous research on patients in palliative care had reported the standard deviation of the ESAS anxiety on two occasions – the first was 2.9cm, and the second was 2.8cm. Another study reported that the correlation of ESAS anxiety measured 1 day apart was 0.62. Together, this information was used to estimate the standard deviation of ESAS change score as 2.5cm.
The table below shows the power for various average differences between the groups; the power for detecting an average difference of 1cm, for example, is 0.33. The average confidence interval width for the mean difference between the groups is 2.6, if the sample size is 30 in each group and if the standard deviation of the ESAS change score is 2.5cm. Of course, the confidence interval in the actual study will be subject to random variation and will have a slightly different location and width.
| True average difference between groups in anxiety change | Power |
|---|---|
| 0.5 | 0.12 |
| 1.0 | 0.33 |
| 1.5 | 0.63 |
| 1.8 | 0.78 |
| 2.0 | 0.86 |
| 2.5 | 0.97 |
These illustrative calculations are based on the correlation between the two measurements of ESAS anxiety scores (before and after the intervention) being about 0.6. This estimate of the correlation came from a study where ESAS anxiety was measured 1 day apart. Anne planned to measure anxiety twice within two hours, so it was possible that the correlation between the two measurements would be higher than 0.6.
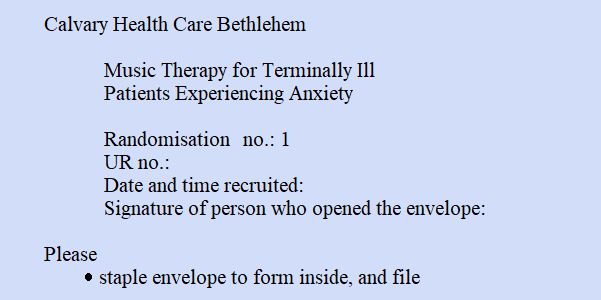
Randomisation procedure
A statistician prepared a randomisation list. Sixty patients were randomised to either the control or music therapy groups in (six) blocks of ten. The randomisation procedure ensured that there were five patients assigned to each treatment in each block.
The statistician prepared 60 envelopes providing the randomisation for each of 60 patients. Each envelope was numbered from 1 to 60; the randomisation was inside. The envelopes were kept at the hospital where the study was being conducted. When the first patient had been recruited to the study, the first envelope was opened; when the second patient was recruited, the second was opened, and so on. Anne or another music therapist involved in the study opened the envelope.
Data collection
Protocol
| Patient identification | Terminally ill patients aged between 18 and 90 years of age receiving palliative care at Calvary Health Care Bethlehem were included in the study. Patients were eligible if they were referred to the hospital’s music therapists for treatment of their anxiety. |
|---|---|
| Exclusion criteria | Potential participants were excluded if they: (a) were unable to speak English, (b) had a major hearing impairment, or (c) scored more than 10 on the Blessed Orientation, Memory and Cognition instrument. This includes a series of simple tasks such as counting backwards, saying the months backwards and asking about orientation to time; people scoring more than 10 are regarded as cognitively impaired. |
| Patient recruitment | Anne did not recruit the patients. They were invited to participate by other staff members, and given a plain language explanation of the study. The study was described as assessing the effects of music therapy and volunteer and other services in the hospital on peoples’ symptoms. Patients were given about 30 minutes to consider participating. |
| Informed consent | Patients agreeing to participate were asked to sign an Informed Consent form. |
| Refusal to participate | If the patient did not wish to participate, he or she was offered music therapy and visits by volunteers. |
| Assignment to treatments | When the consent form was completed, Anne (or another music therapist assisting with the study) opened the relevant randomisation envelope (the first envelope for the first patient recruited, the second envelope for the second patient recruited, and so on). A treatment session was then arranged. |
| Data collection prior to the intervention | Three sets of data were collected by a staff member who was not involved in the study. This included measuring heart rate, filling in the Behavioural Observation Checklist, and assisting the patient with completing the Edmonton Symptom Assessment Scale. Prior to the intervention, Anne or another music therapist recorded demographic and medical information about the patient and completed the Eastern Cooperative Oncology Group performance status. |
| Music therapy | Therapy sessions were held one-on-one in the patient’s room. Anne or one of the other hospital music therapists used a range of music therapy techniques to reduce anxiety. |
| Standard therapy | Sessions with a volunteer were held one-on-one in the patient’s room. |
| Data collection post-intervention | Data were collected by the same staff member who collected the pre-intervention information. Again heart rate was measured, the Behavioural Observation Checklist was completed, and the Edmonton Symptom Assessment Scale was filled in. |
Reference
A paper about the Blessed Orientation, Memory and Cognition instrument:
Katzman, R., Brown, T., Fuld, P., Schechter, R., & Schimmel, H. (1983). Validation of a short Orientation-Memory-Concentration Test of cognitive impairment. American Journal of Psychiatry, 140(6), 734-739.
Analysis
Summary
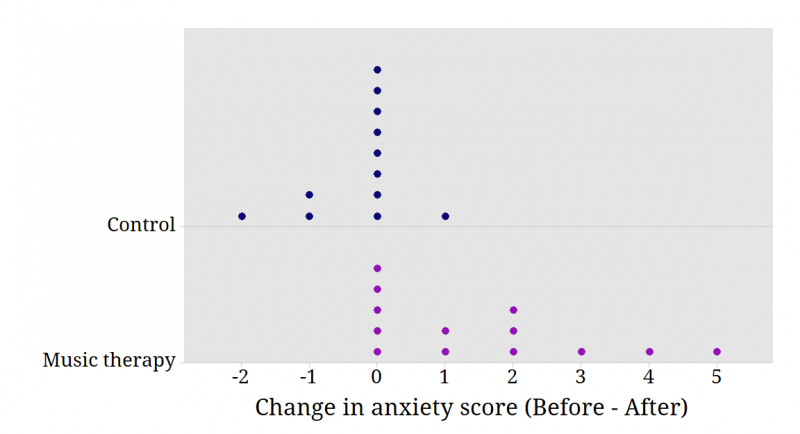
Thirty patients were recruited for the study, but only 12 control patients and 13 music therapy patients participated. Five patients either died or were discharged before the intervention was completed. The primary outcome was the change in ESAS anxiety rating from before to after treatment. The figure below shows these change scores for each group; since a higher ESAS score indicates higher anxiety, and the change has been calculated as (before minus after), a positive change reflects an improvement.
The reduction in ESAS anxiety on the VAS was, on average, 1.8 cm more for the music therapy group than for the control group. As the sample sizes are small and the distribution of the data is unlikely to be well approximated by the normal distribution, a bootstrap method was used to find a 95% confidence interval for the mean difference between the groups in the change in ESAS anxiety score; this was (0.9, 2.8).
Questions to consider
- Consider each group in the study separately. Work out some relevant statistical summaries in each group.
- When planning the study, an assumption was made about the strength of the correlation between measurements of anxiety on two occasions. Illustrate how the power of the study would change if the correlation was stronger than was assumed.
- Investigate the actual correlation between measurements of anxiety before and after the intervention irrespective of group. How does the result compare with the assumption made for the power analysis?
- On the analysis page a 95% confidence interval for the mean difference between the groups in the change in ESAS anxiety score was reported: (0.9, 2.8). It was calculated using bootstrap methods. How does this compare with the result from a standard method of calculating the confidence interval?
- Investigate the correlation between measurements of anxiety before and after the intervention for each group. Produce a visual display showing the relationship between the two measurements separately for each group. What does the visual display suggest about the relationship in each group? (Jittering may be useful on your display.)
- Consider predicting post-intervention anxiety from pre-intervention anxiety in each group. Obtain the regression equations, and interpret the slope and intercept in each case. What differences between the interventions does this suggest?
- Consider the ECOG performance status measured on each patient. The randomisation procedure should ensure that both groups are similar in terms of ECOG performance status. Investigate the distribution of this measure in the two groups; use visual displays and summary statistics.
- Compare the effects of the interventions on several outcomes including pain and shortness-of-breath. Consider appropriate methods of statistical inference for comparing the interventions. Present and summarise the findings using visual displays, and summary statistics.
- Examine the change in heart rate for each group. Examine the distribution of these data and suggest an appropriate method for comparing the effects of the interventions. Carry out an analysis to compare the effects of the interventions on heart rate.
- On examining the change in heart rate in the music therapy group, a colleague notices one patient’s heart rate increased by 47 beats per minute. He suggests to you that this patient should be excluded from the study. What do you say?
- Why was it important that someone other than Anne recruited participants to her study?
- The study was described to patients as assessing the effects of music therapy and volunteer and other services in the hospital on people’s symptoms. Why wasn’t Anne more explicit in describing the treatment and outcome she was interested in?
- Imagine that you are asked to present the key findings of Anne’s study to staff at the hospital who have little knowledge of statistics. Write a brief summary of the key findings explaining any statistical terms that you use. Include some visual displays that highlight the main outcome.
- Anne was aiming for a total of 60 subjects, but ultimately only recruited a total of 30. Data were obtained from 25 of the 30 patients recruited. Was this a problem?
Data
Definition of variables in the data file
| Randomisation | Randomisation number |
|---|---|
| Gender | M=Male, F=Female |
| ECOG | Eastern Cooperative Oncology Group performance status (see Background for details) |
| Group | Treatment group: Control or Music therapy |
| Duration | Time of treatment in minutes |
| pre BPM | Heart rate in beats per minute prior to treatment |
| post BPM | Heart rate in beats per minute after treatment |
| pre pain | ESAS level of pain prior to treatment |
| pre tiredness | ESAS level of tiredness prior to treatment |
| pre nausea | ESAS level of nausea prior to treatment |
| pre depression | ESAS level of depression prior to treatment |
| pre anxiety | ESAS level of anxiety prior to treatment |
| pre drowsiness | ESAS level of drowsiness prior to treatment |
| pre appetite | ESAS level of appetite prior to treatment |
| pre wellbeing | ESAS level of wellbeing prior to treatment |
| pre SOB | ESAS level of shortness of breath prior to treatment |
| post pain | ESAS level of pain after treatment |
| post tiredness | ESAS level of tiredness after treatment |
| post nausea | ESAS level of nausea after treatment |
| post depression | ESAS level of depression after treatment |
| post anxiety | ESAS level of anxiety after treatment |
| post drowsiness | ESAS level of drowsiness after treatment |
| post appetite | ESAS level of appetite after treatment |
| post wellbeing | ESAS level of wellbeing after treatment |
| post SOB | ESAS level of shortness of breath after treatment |
Data from the Behavioural Observation Checklist are not provided.
Glossary
Bootstrapping
A statistical technique used to estimate the sampling distribution of an estimator by resampling the data a large number of times.
Informed consent
Asking individuals to be part of any study requires obtaining their informed consent. There are ethical and legal requirements for obtaining consent in an appropriate way. Participants must be given information about the purpose, methods, demands, risks, inconveniences, discomforts, and possible outcomes of the research. This information must be presented in a way that is easy to understand. An individual’s choice to participate is voluntary. The National Health and Medical Research Council (Australia), for example, has guidelines about the ethical conduct of research with humans.
Here is Anne’s Consent Form.
Visual Analogue Scale (VAS)
A scale that is used to obtain a subjective measurement of some characteristic, as a continuous variable. It is usually presented as a continuous line with labelled endpoints. People are asked to mark a point on the line to represent where they think they fall. Sometimes intervals along the line are numbered. The example below shows a VAS for rating how much pain you are in.
