Sorting out the rubbish
Introduction
This case study is based on a real court case between a Council in the state of Victoria, Australia, and a garbage collection company. To maintain the anonymity of the parties involved, some false names are used here: the garbage collection company is called Dumpers, for example. One aspect of the dispute was about the weighbridge that records the weight of garbage trucks entering and leaving the Council tip. Garbage companies are charged a fee on the basis of the weight of garbage dumped at the tip. Dumpers alleged that there was a problem with the weighbridge; they asked an adviser, Dr. Johns, to examine the weighbridge records to see if there were any “irregularities” in the weighbridge operation. Dr. Johns provided a report suggesting that there were problems with the weighbridge. The Council decided to call Ian Gordon, a statistical consultant, to review Dr Johns’ report and conclusion.
The key questions that the Council wanted to answer were:
- Was Dr. Johns’ conclusion justified?
- Was there anything wrong with the weighbridge?
Timeline
- January to July 1997
- Early 1998
-
Dumpers asks Dr Johns to review the weighbridge operation.
Study design and the problem described. - August 1998
-
Dr Johns reports.
- August 1998
-
Council asks Ian Gordon to review Dr Johns’ report.
Data analysis. - September 1998
-
Ian Gordon reports to Council.
Available data
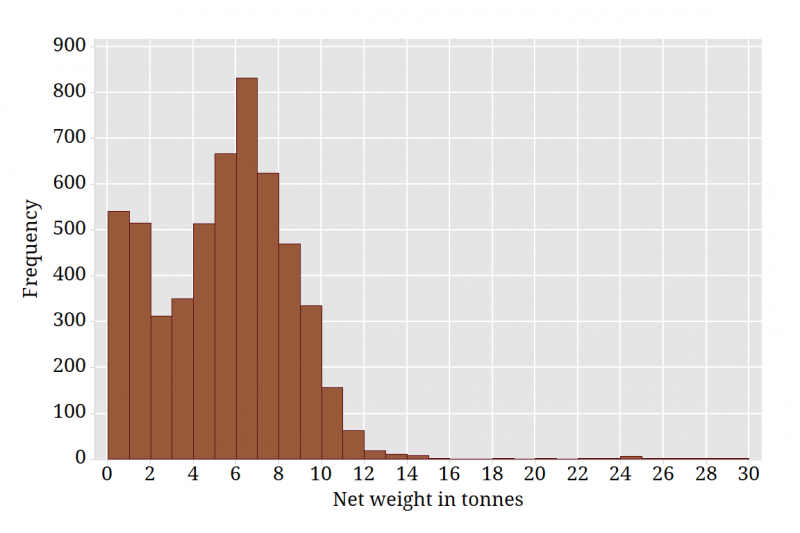
Weighbridge data from January to June 1997 were available for analysis. During this time, trucks from 40 different companies were weighed. Some companies dumped rubbish on very few occasions over the 6 month period; others dumped many hundreds of loads.
Dr Johns’ conclusion
“The pattern of tonnages is unlikely to have occurred by chance.”
In particular:
- There are unusual counts of net garbage weights for a number of companies; these counts would not be expected by chance.
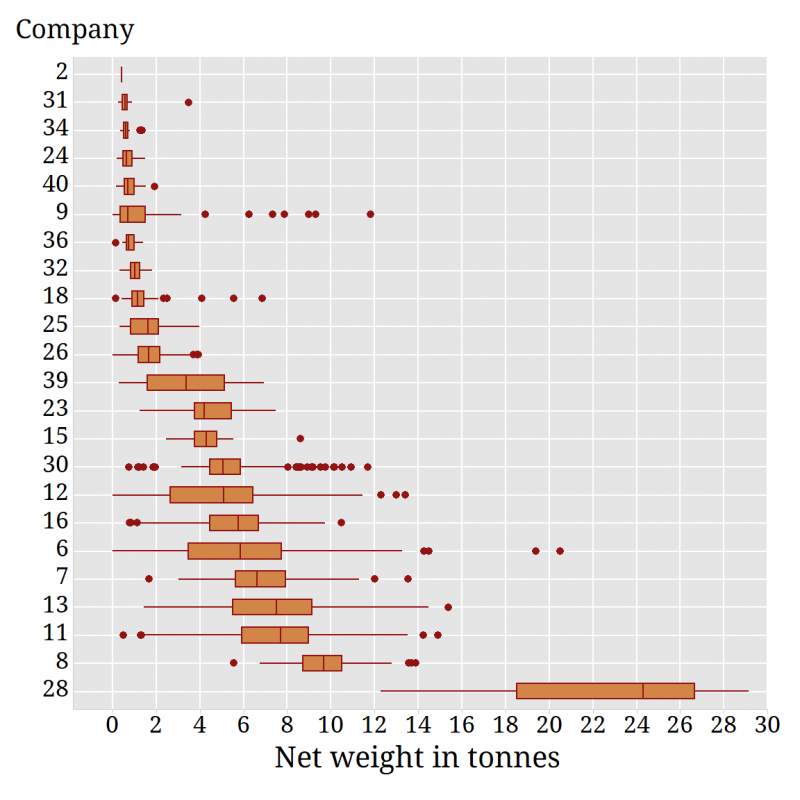
- Company 2 shows an extremely unusual set of observations; all 29 net weights are 0.40 tonnes.
- There are a small number of data entry errors, as some weights do not round to 20kg. (Note that weights were measured to the nearest 20kg.)
Dr Johns’ analysis
Part 1: Organising the data.
- Split the dataset into subsets according to company. Each company should be analysed separately as they have different-sized trucks and carry different kinds of rubbish.
- Divide the net weight data into one-tonne ranges (e.g. 0 to 1 tonne, 1 to 2 tonnes, etc.).
- Within any one tonne range, there are 50 possible weight values, as weights are measured to the nearest 20kg.
- Tabulate the distribution of weights in a one-tonne range.
Part 2: Analysing the weights in any given one-tonne range, for a particular company.
- Let the number of weights observed = n
- Assume that the distribution of weights should be uniform.
- Model the count, X, at any specific weight in the range, as a binomial random variable: X ~ Bi(n, 1/50).
- Calculate the expected frequency of each count according to the binomial model, across the 50 weights.
- Make a judgment about how unusual the observed count is compared with that predicted by the binomial model.
Example of Dr Johns’ analysis
Company 11 had 253 net weights in the range 7 to 8 tonnes. There are two weights that do not round to 20kg. As the reasons for these errors are unknown, these weights were removed from the analysis.
Part 1
Distribution of net weights between 7.00 and 7.98 tonnes for Company 11 (n = 251)
| Weight | Count | Weight | Count | Weight | Count | Weight | Count | Weight | Count |
| 7 | 5 | 7.2 | 5 | 7.4 | 4 | 7.6 | 3 | 7.8 | 5 |
| 7.02 | 7 | 7.22 | 4 | 7.42 | 2 | 7.62 | 4 | 7.82 | 6 |
| 7.04 | 4 | 7.24 | 4 | 7.44 | 0 | 7.64 | 4 | 7.84 | 2 |
| 7.06 | 3 | 7.26 | 7 | 7.46 | 4 | 7.66 | 7 | 7.86 | 8 |
| 7.08 | 3 | 7.28 | 5 | 7.48 | 6 | 7.68 | 5 | 7.88 | 8 |
| 7.1 | 6 | 7.3 | 6 | 7.5 | 6 | 7.7 | 10 | 7.9 | 5 |
| 7.12 | 2 | 7.32 | 5 | 7.52 | 2 | 7.72 | 4 | 7.92 | 4 |
| 7.14 | 3 | 7.34 | 4 | 7.54 | 5 | 7.74 | 8 | 7.94 | 11 |
| 7.16 | 3 | 7.36 | 5 | 7.56 | 5 | 7.76 | 6 | 7.96 | 7 |
| 7.18 | 8 | 7.38 | 8 | 7.58 | 3 | 7.78 | 5 | 7.98 | 5 |
Part 2
- Assuming the distribution of weights is uniform within this one tonne range, the expected count (for any weight) is 251 x 1/50 = 5.02.
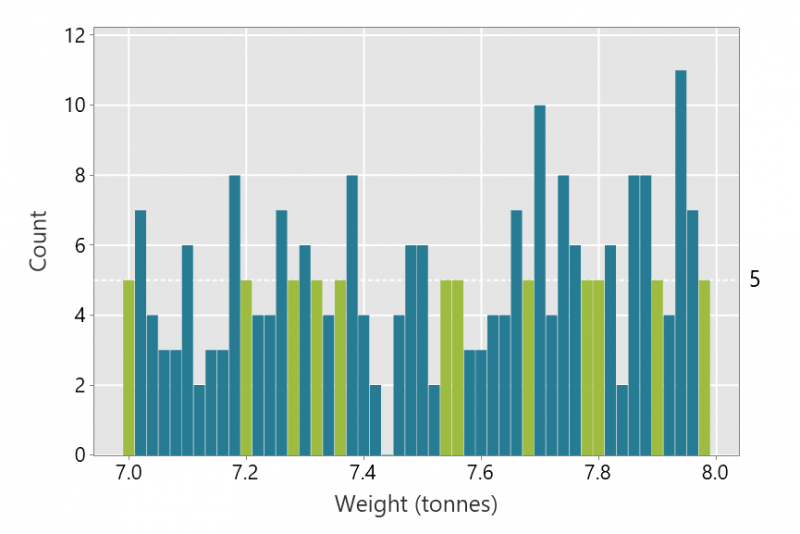
- Note that, for example, a count of 5 occurs 12 times, as is shown in bold in the table above. The distribution of net weights between 7.00 and 7.98 tonnes for Company 11 (n = 251) is also shown in the figure below. Counts of 5 are highlighted in green.
- Assuming the counts at any single weight, X, are distributed as Bi(251, 0.02), Pr(X = 5) = 0.1772.
- The binomial model predicts 50 x 0.1772 = 8.86, or about 9 values of 5 across 50 weight categories.
- Twelve counts of 5 were observed, compared to 8.86 expected – Dr. Johns concluded that this was unusually high.
Study design
Variables
- Garbage company
- Net weight of garbage
Statistician’s description of the design
The data set is simply a set of consecutive observations over time on a number of garbage trucks owned by 40 companies.
Statistician’s description of the problem
The problem is to determine if there are any characteristics of the observations that suggest that there is anything wrong with the weighbridge or the weighing procedures.
Protocol at the weighbridge
| Inclusion criteria | Every commercial garbage truck must be weighed at the tip weighbridge prior to entry to the tip and following dumping of their load at the tip. |
|---|---|
| Data to be recorded before entry to the tip |
The weighbridge supervisor records the following information for each vehicle:
|
| Data to be calculated | The weighbridge supervisor enters the weight before entry and the TARE into a computer program. The weighbridge supervisor’s computer calculates:
|
| Data analysis | Daily records are forwarded by the supervisor to the council for later analysis. |
Analysis
Summary
Ian Gordon disagreed with Dr Johns’ analysis. Ian proposed alternative methods of assessing the weighbridge data; he suggested that the assumption that net weights were uniform over one tonne ranges was questionable, and commented on the selectivity of the analyses presented.
Questions to consider
- Produce a graphical display that will make the problem with the weights of company 2 apparent to Council members.
- Consider Dr Johns’ analysis. Review and comment on his assumptions.
- Do you expect the distribution of net weights within a 1 tonne range to be uniformly distributed? Explain why or why not.
- Draw graphical displays to describe the distribution of net weights within 1 tonne ranges for different companies.
- Consider Dr Johns’ conclusion about unusual counts within 1 tonne net weight ranges. Propose and carry out an alternative analysis for the 7 to 8 tonne range for company 11, assuming the uniform model. Are Dr Johns’ conclusions reasonable in this case?
- Repeat the analysis above for another weight range for company 11.
- Dr. Johns chose subsets of the data to analyse. Is there a problem with this? How would you overcome it?
- Has the Dr Johns provided sufficient evidence for his conclusions? Explain why or why not.
- Is there anything wrong with the weighbridge? Write a brief report to Council.
Data
Definition of variables in data file
| Company | Garbage collection contractor (Numerical codes for anonymity) |
|---|---|
| Net weight of garbage (tonnes) | Net weight of garbage in tonnes |