Analysis and data
Analysis
Summary
Ian Gordon disagreed with Dr Johns’ analysis. Ian proposed alternative methods of assessing the weighbridge data; he suggested that the assumption that net weights were uniform over one tonne ranges was questionable, and commented on the selectivity of the analyses presented.
Questions to consider
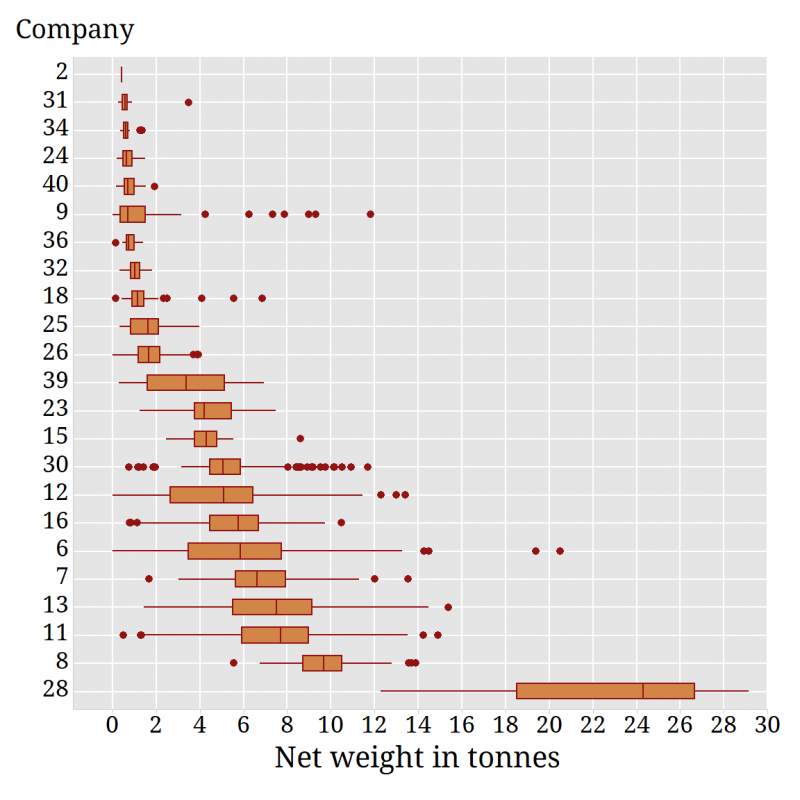
- Produce a graphical display that will make the problem with the weights of company 2 apparent to Council members.
- Consider Dr Johns’ analysis. Review and comment on his assumptions.
- Do you expect the distribution of net weights within a 1 tonne range to be uniformly distributed? Explain why or why not.
- Draw graphical displays to describe the distribution of net weights within 1 tonne ranges for different companies.
- Consider Dr Johns’ conclusion about unusual counts within 1 tonne net weight ranges. Propose and carry out an alternative analysis for the 7 to 8 tonne range for company 11, assuming the uniform model. Are Dr Johns’ conclusions reasonable in this case?
- Repeat the analysis above for another weight range for company 11.
- Dr. Johns chose subsets of the data to analyse. Is there a problem with this? How would you overcome it?
- Has the Dr Johns provided sufficient evidence for his conclusions? Explain why or why not.
- Is there anything wrong with the weighbridge? Write a brief report to Council.
Data
Definition of variables in data file
| Company | Garbage collection contractor (Numerical codes for anonymity) |
|---|---|
| Net weight of garbage (tonnes) | Net weight of garbage in tonnes |